
Impact of Spatio-Temporal Scale on Variational Assimilation in Hydrologic Models
This study evaluates how the spatio-temporal scale of adjustment affects variational assimilation (DA) of hydrologic and hydrometeorological data in operational distributed hydrologic models. By implementing real-world experiments across nine basins in Oklahoma and Texas, we explore various control vectors for DA, assessing the performance at different spatial and temporal scales. Our findings reveal significant insights on reducing RMSE in streamflow forecasting while adhering to model dynamics. The results contribute to improved hydrological predictions and resource management.

Impact of Spatio-Temporal Scale on Variational Assimilation in Hydrologic Models
E N D
Presentation Transcript
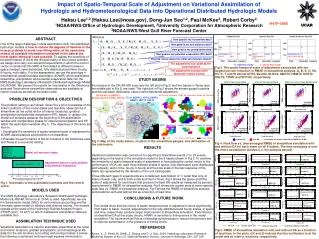
Impact of Spatio-Temporal Scale of Adjustment on Variational Assimilation of Hydrologic and Hydrometeorological Data into Operational Distributed Hydrologic Models Haksu Lee1,2 (Haksu.Lee@noaa.gov), Dong-Jun Seo1,2, Paul McKee3, Robert Corby31NOAA/NWS/Office of Hydrologic Development, 2University Corporation for Atmospheric Research 3NOAA/NWS/West Gulf River Forecast Center ATIT2 (O) BLUO2 (O) ELDO2 (O) ATIT2 (I) BLUO2 (I) ELDO2 (I) GBHT2 (O) HBMT2 (O) HNTT2 (O) GBHT2 (I) HBMT2 (I) HNTT2 (I) KNLT2 (O) TIFM7 (O) WTTO2 (O) KNLT2 (I) TIFM7 (I) WTTO2 (I) Outlet flow assimilated Interior flow assimilated Outlet & interior flows assimilated RMSE of streamflow RMSE of streamflow RMSE of streamflow Verified at outlet (48%) Verified at outlet (19%) Verified at outlet (46%) Peak flow (cms) Peak flow (cms) Peak flow (cms) RMSE of streamflow RMSE of streamflow RMSE of streamflow Verified at interior(16%) Verified at interior(43%) Verified at interior(36%) TIFM7, OK (2258 km2) WTTO2, OK (1645 km2) ELDO2, OK (795 km2) UZTWCi,K-L UZFWCi,K-L LZTWCi,K-L LZFSCi,K-L LZFPCi,K-L (i=1, …, nG) Model soil moisture states Peak flow (cms) Peak flow (cms) Peak flow (cms) TIFM7 without DA with DA ( %) indicates the percent reduction in RMSE due to DA XP,k and XE,k (k=K-L+1, …, K) Adjustment factors to precipitation and potential evaporation BLUO2, OK (1232 km2) HNTT2, TX (769 km2) ATIT2, TX (844 km2) … WTTO2 KNLT2, TX (904 km2) GBHT2, TX (137 km2) HBMT2, TX (246 km2) ELDO2 BLUO2 outlet Interior stream gauge stream network Outlet flow DA No DA Outlet & interior flow DA Interior flow DA H41F-0956 UCAR Minimize ABSTRACT One of the large challenges in data assimilation (DA) into distributed hydrologic models is how to reduce the degrees of freedom in the inverse problem to avoid over-fitting while, at the same time, extract all available information contained in the data at the finest spatio-temporal scale possible. To assess the sensitivity of the performance of DA to the dimensionality of the inverse problem, we design and carry out real-world experiments in which the control vector in variational DA (VAR) is formulated at different scales in space (lumped, semi-distributed, fully-distributed) and time (hourly, 6-hourly, multi-daily). For the assessment, we use the prototype 4-dimenational variational data assimilator (4DVAR) which assimilates streamflow, precipitation and potential evaporation data into the NWS Hydrology Laboratory’s Research Distributed Hydrologic Model (HL-RDHM). We present the results for nine basins in the Oklahoma area and Texas where streamflow observations are available at interior locations as well as the basin outlet. How good is my streamflow data? How good is my soil moisture data? How good is my precipitation data? How good is my potential evaporation (PE) data? What do I know about the initial soil moisture states? The adjustments must abide by the model dynamics Fig 3. The spatio-temporal scale of adjustment associated with the largest percent reduction in RMSE in streamflow analysis. A, B, E, G, Hb, Hn, K, T and W denote ATIT2, BLUO2, ELDO2, GBHT2, HBMT2, HNTT2, KNLT2, TIFM7 and WTTO2, respectively. The adjustments must be within physically realistic bounds STUDY BASINS Four basins in the OK-AR-MO area (see the left plot in Fig 2) and five basins in Texas (see the middle plot in Fig 2) are used. The right plot in Fig 2 shows the stream gauge locations and the sub-basin delineation used in semi-distributed adjustment. OK-AR-MO (in ABRFC): BLUO2, ELDO2, TIFM7, WTTO2 TX (in WGRFC): ATIT2, GBHT2, HBMT2, HNTT2, KNLT2 PROBLEM DESCRIPTION & OBJECTIVES The problem setting is as follows. Given the a priori knowledge of the initial conditions of the model states and real-time observations of streamflow (at the outlet and/or at interior locations), gridded precipitation and potential evaporation (PE), adjust, or update, the model soil moisture states at the beginning of the assimilation window and multiplicative biases for observed precipitation and PE within the assimilation window (Fig 1). The objectives of this work are then to: Investigate the sensitivity of spatio-temporal scale of adjustment to 4DVAR-aided analysis and prediction of streamflow Evaluate the performance of DA for 9 basins in the Oklahoma area and Texas in a real world setting. Fig 2. Map of the study basins, location of the streamflow gauges, and delineation of the sub-basins Fig 4. Peak flow vs. time-averaged RMSE of streamflow simulation with and without DA for each event for all 9 basins. The time averaging is over the entire assimilation window (i.e. the analysis period). RESULTS Variational assimilation was carried out for significant streamflow events (7 to 23 events depending on the basin) in the simulation mode for the 9 basins shown in Fig 2. To examine the sensitivity of spatio-temporal scale of adjustment in formulating the control vector to the performance of DA, we used three different scales in space, fully-distributed, semi-distributed and lumped), and in time, hourly, 6-hourly and the time scale of the fast response of the basin (as represented by the duration of the unit hydrograph). Three different types of experiments are considered: assimilation of 1) outlet flow only, 2) interior flow(s) only, and 3) both outlet and interior flows. Fig 3 shows the space and time scale of adjustment for each basin that produce the best DA results as measured by percent improvement in RMSE for streamflow analysis. Fig 4 shows the scatter plots of event-specific peak flow vs. RMSE of streamflow analysis. Fig.5 shows the RMSE of streamflow analysis and prediction with and without DA as a function of lead time. Fig 1. Schematic of the assimilation window and the control vector MODELS USED The NWS Hydrology Laboratory’s Research Distributed Hydrologic Model (HL-RDHM, Koren et al. 2004) is used. Specifically, we use the Sacramento model (SAC) for soil moisture accounting and the kinematic-wave model for hillslope and channel routing. The models operate at the scale of the Hydrologic Rainfall Analysis Project (HRAP) grid (~16 km2) on which multisensor precipitation data are available also. CONCLUSIONS & FUTURE WORK The results show that the choice of spatio-temporal scale of adjustment varies significantly from basin to basin. Overall, adjustments for the fully-distributed and hourly scales, in space and time, respectively, produce larger improvement in streamflow simulation. Performance of streamflow DA at fine scale (hourly, HRAP) is sensitive to timing errors in the model simulation. The future work will focus of developing techniques to reduce timing errors and to improve performance in the presence of timing errors. ASSIMILATION TECHNIQUE USED Variational assimilation is used to assimilate streamflow at the outlet and interior locations, gridded precipitation, and climatological PE data into the soil moisture accounting and routing models. It solves the following constrained nonlinear least-squares minimization: REFERENCES Koren, V., S. Reed, M. Smith, Z. Zhang, and D.-J. Seo, 2004. Hydrology Laboratory Research Modeling System of the U.S. National Weather Service, Journal of Hydrology, 291, 297-318. Fig 5. RMSE of streamflow simulation with and without DA as a function of lead time. In the plots, (O) and (I) indicate that the verification is at the outlet and all interior locations, respectively.


