Download
1 / 68
690 likes | 874 Views
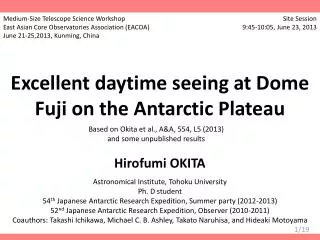
Astronomical site evaluation at Dome Fuji on the Antarctic plateau. Hirofumi OKITA. June 17, 2013. Based on Okita et al., A&A, 554, L5 (2013) and some unpublished results. Contents. Introduction Instrumentations Data processing and error analysis Results Discussion and conclusion

E N D
Astronomical site evaluation at Dome Fuji on the Antarctic plateau Hirofumi OKITA June 17, 2013 Based on Okita et al., A&A, 554, L5 (2013) and some unpublished results
Contents Introduction Instrumentations Data processing and error analysis Results Discussion and conclusion Future work
Contents Introduction Instrumentations Data processing and error analysis Results Discussion and conclusion Future work
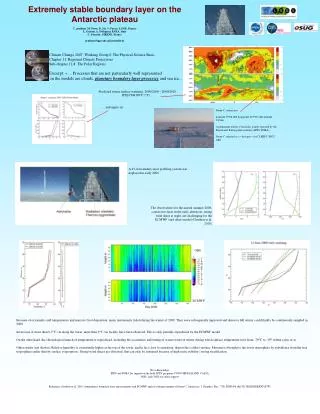
1. 1 Aim of this study The aim of this study is to investigate the astronomical seeing in the free atmosphere above and to determine the height of the surface boundary layer at Dome Fuji on the Antarctic plateau.
1. 2 Turbulence in the Atmosphere Object Atmosphere Telescope Bright Star (Arcturus) Observed with Lick Observatory's 1-m Telescope.(Copyright: Claire Max, http://cfao.ucolick.org/EO/resources/History_AO_Max.pdf)
1. 3 Seeing Seeing is a parameter that describes how blurry a star image will be. It is caused by atmospheric turbulence and is the apparent angular diameter of a point source measured in arcsecond. Bright Star (Arcturus) Observed with Lick Observatory's 1-m Telescope.(Copyright: Claire Max, http://cfao.ucolick.org/EO/resources/History_AO_Max.pdf) at wavelength of 500 nm PSF 0.75 mag 0.3” 0.6” Good seeing brings not only high resolution imaging, but also more deeper detection limit. good seeing excellent seeing It is important to choice ”the site”.
1. 4 Kolmogorov Model In the inertial range, the Velocity fluctuations V [L T-1] are governed only by the scale size l [L] and the rate of energy input and dissipation ε [L2T-3]. Dimensional consideration, Kolmogorov (1941) Structure function Correlation function Tyson & Frazier (2012)
1. 5 Structure function Velocity structure function Kolmogorov (1941) Tatarskii (1971) Temperature structure function Refractivity P = pressure in mill bar T = temperature, K Refractive index structure function
1. 6 Fried parameter & seeing Phase structure function k = 2π/λ ζ = zenith angle Fried parameter Seeing Fried defined the parameter r0 , which is the diameter of a telescope which would have the same resolving power as in the atmospheric turbulence
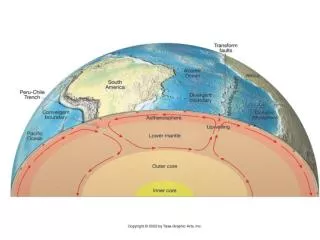
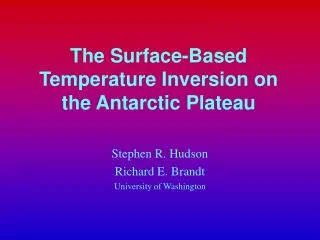
1. 7 Atmosphere structure Wind shear Wind shear Solar heating Friction “Adaptive Optics for Astronomical Telescope” (Hardy 1998) Surface Boundary Layer Planetary boundary layer Tropopause (Jet-stream)
1. 8 Atmosphere structure During the day, turbulence is usually strongest near the ground, in response to solar heating and the development of thermal currents. At nigh, especially at good observing sites, surface turbulence is low and most disturbances occur in layers at higher altitudes, especially at the tropopause, as a result of wind shear. The best observing sites are located on mountain peaks near the ocean, which has a moderating effect on temperature variations. (“Adaptive Optics for Astronomical Telescope”, Hardy 1998) World’s best astronomical seeing sites La Palma Mauna Kea Chajnantor Paranal “Adaptive Optics for Astronomical Telescope” (Hardy 1998)
1. 9 CN2distribution at Mauna Kea Effect of the surface boundary layer is negligible because the telescope locates at the top of the mountain and the telescope is mounted on high pillar. Refractive index parameter CN2 hSBL ~ a few x 10 m Height (km) “Adaptive Optics for Astronomical Telescope” (Hardy 1998) - Background turbulence alone = 0.36 arcsec - Addition of the single layer = 0.53 arcsec
1. 10 On the Antarctic plateau Syowa Station Okita et al. 2010 Stable atmosphere Weak wind shear • No diurnal temperature variation in winter • weak wind-shear (polar vortex) • smooth snow surface • Dome = local maxima of the plateau South Pole
1. 11 CN2distribution on Antarctica Lascaux et al. (2011) Lascaux et al. (2011) - No strong turbulence at high altitude - Strong surface boundary layer near the surface
1. 12 CN2distribution on Antarctica 15 ~ 30m at Dome A, C, (and F?) Lascaux et al. (2011)
1. 13 Atmosphere structure at “Dome” Height Stratosphere Free Atmosphere Astronomical seeing at “Dome” on the Antarctic plateau is generally considered as the super-position of the contributions from two layers; the surface boundary layer and the free atmosphere above. ~10km Troposphere 200 ~ 10 m Surface Boundary Layer • On the Antarctic plateau has only two component of turbulence, • Surface boundary Layer near the snow surface, and • Free atmosphere above it
1. 14 Wind speed Dome C Paranal Mauna Kea South Pole Jet stream full line = summer dashed = winter Altitude (km) Aristidi et al. (2005) Wind speed (m/s) Polar vortex “In sub-polar regions the speed of the vortex decreases with increasing latitude.” Aristidi et al. (2005) Latitude of Dome C = 75 degree
1. 15 Previous studies (Simulation) Dome Fuji Swain & Gallee (2006) Simulation of the height of the surface boundary layer Saunders et al. (2009) Simulation of the free atmosphere seeing Simulations suggest that the free atmosphere seeing could be 0.21”and the height of the surface boundary layer is 18 m at Dome Fuji (Saunders et al. 2009; Swain & Gallee 2006).
1. 16 Previous studies (site tests) Dome C Dome A Seeing distribution CT2 distribution Aristidi et al. (2009) height (m) Bonner et al. (2009) Seeing (arcsec) Median height = 13.9m (a) above surface layer (c) Inside surface layer (b) intermediate Dome Fuji not observed yet
1. 17 Aim of this study The aim of this study is to investigate the astronomical seeing in the free atmosphere above and to determine the height of the surface boundary layer at Dome Fuji on the Antarctic plateau.
Contents Introduction Instrumentations Data processing and error analysis Results Discussion and conclusion Future work
2. 1 Measuring quantity Refractive index structure function Phase structure function Fried parameter Seeing
2. 2 CT2, Dα(r) ε DIMM α= incidence angle φ= phase SODAR Snodar Ultrasonic anemometer Micro-thermal sensor Balloon-bone temperature sensor In this presentation, we only discus the data of DIMM and SODAR.
2. 3 DIMM principle Differential Image Motion Monitor r DIMM measures the variance of the incidence angles on the detector CCD. α= incidence angle DIMM can not measure the profile of CN2. DIMM only measure the integrated value of r0 = “total seeing”
2. 4 DF-DIMM Dome FujiDifferential Image Motion Monitor We used an exclusive small full-automatic telescope on the 9 m astronomical tower in order to be as height as possible within, and sometimes above, the surface boundary layer. Power supply, Communication DF-DIMM PLATO-F 11m
pppp… 2. 5 SODAR principle SOnic Detection And Ranging dh Emit sound and receive the echo. (1) Intensity of echo turbulence strength (CT2) (2) Doppler shift 3-D wind velocity (u, v, w) V Received power Pr(h) is, Takato (2008) Tatarskii (1971)
2. 6 SODAR at Dome Fuji Takato (2008) Unfortunately we had no calibration for η, so we couldn’t convert from Pr to CT2.
2. 7 Observable height 8 ~ 50 m ∝CT2 0 ~ 16 m CT2 wind speed temperature pressure In this presentation we discuss > 11 m seeing and turbulence strength from 40 to 400m. 40 ~ 400 m ∝CT2 Future work > 11m seeing ε > 2m seeing ε Snodar 2011 Weather mast 2011 DIMM 2011 DIMM 2013 SODAR 2006/2007
Contents Introduction Instrumentations Data processing and error analysis Results Discussion and conclusion Future work
Contents Introduction Instrumentations Data processing and error analysis Results Discussion and conclusion Future work
4. 1 Seeing histogram • DIMM observations 11 m above the snow surface at a wavelength of 472nm from 2013 January 1 to January 23 in 2013. • In all, 3768 seeing estimated, each one being the average of 450 images over a period of about five minutes. Note: This larger statistic values are believed to be caused by periods when the telescope was within the turbulence boundary layer.
4. 4 DIMM result • A period of excellent seeing, below 0.2” and continuing about 4 hours, was observed near local midnight at 2013 January 6. • Other periods of excellent seeing, less than 0.3”, were observed close to midnight on a total of six occasions (January 6, 11, 15, 19, 21, and 23) • The seeing has a tendency to have a local minimum of ~0.3” a few hours before local midnight. • This is clear in the data for January 6,7,9, and 16.
4. 5 SODAR time series • SODAR observations from 2006 December 21 to 2007 January 7. • We setup the minimum height hmin = 40 m and the resolution Δh = 20 m. height (m) Takato (2008) Day from December 21, 2007 (UT)
4. 6 Diurnal variation for turbulence • To investigate the diurnal variation of the turbulence, we used the dataset from 2006 December 21 to 2007 January 7 (hmin = 40 m and Δh = 20 m). turbulence strength Convection by the solar heating Height (m) minimum height = 40m Local time (UTC+3)
Contents Introduction Instrumentations Data processing and error analysis Results Discussion and conclusion Future work
5. 1 Cause for excellent seeing Height Stratosphere Model of the atmosphere structure at “Dome” on the Antarctic plateau Free Atmosphere ~10km Troposphere 1) 2) 3) disappearance of the surface boundary layer the surface boundary layer is below the level of the telescope the surface boundary layer is higher than the level of the telescope 10 ~ 200 m Surface Boundary Layer
5. 2 Disappearance of the SBL • A similar local minimum before midnight has also been seen at Dome C • Aristidi et al. (2005) has interpreted this as the disappearance of the surface boundary layer. • Our results are consistent with this.
5. 3 Above SBL • The excellent seeing at local midnight has not been reported at Dome C. • The weak solar energy input at midnight is expected to result in an intense temperature gradient near the snow surface at this time. • This strong temperature gradient should produce a strong surface boundary layer, and hence poor seeing from the surface. • This is only consistent with our observations if the surface boundary layer is below the level of the telescope. • Our DIMM was above the surface boundary layer during these periods, and was sampling the free atmosphere seeing.
5. 4 Diurnal variation for seeing We plot all seeing data, • Large seeing value • Observation inside SBL • Small seeing value • Observation above SBL 0.2” 0 6 12 18 24 Local time (UTC+3) ~0.2” seeing can be observed every time except around noon. This means that the free atmosphere seeing will be ~0.2” every time around noon.
5. 5 Considering SODAR results Turbulence strength Integrate from 40 to 400m, • Turbulence of 40-400m would be caused by the Convection of the solar heating. • Turbulence is almost constant except around noon.
5. 6 Effect of convection Lower limit of the seeing value correlates with the turbulence strength of 40-400m. At 18h–6h (nighttime), the seeing value depends on the height of the surface boundary layer and its strength. When low SBL, we can obtain ~0.2” seeing. At 6h-18h (daytime), convection by the solar heating makes worse the seeing value even in the low SBL. Around 18h, seeing value tends to small by disappearance of SBL.
5. 7 Conclusions Model turbulence profile At Dome Fuji on the Antarctic plateau, Height • Thefree atmospheseeing is ~0.2”. • The height of the surface boundary layer can be as low as ~11 m. • At daytime the convection by the solar heating makes worse the free atmosphere seeing. Free Atmosphere Polar Vortex ~10km 0.2” ~300m Convection ~10m Surface Boundary Layer 0 12 24 hour
Contents Introduction Instrumentations Data processing and error analysis Results Discussion and conclusion Future work
6. 1 Aim of this study The aim of this study is to investigate the astronomical seeing in the free atmosphere above and to determine the height of the surface boundary layerat Dome Fuji on the Antarctic plateau.
6. 2 Observable height 8 ~ 50 m ∝CT2 0 ~ 16 m CT2 wind speed temperature pressure 40 ~ 400 m ∝CT2 > 11m seeing ε > 2m seeing ε Snodar 2011 Weather mast 2011 DIMM 2013 DIMM 2011 SODAR 2006/2007
6. 3 DIMM at 2 m Preliminary Result about 2m
6. 4 Weather mast Pt 15.8 Sonic 14.4 Pt 12.0 (C) Young Company Pt 9.5 Sonic anemometer Pt sensor Sonic 6.1 Temperature gradient Preliminary Result Barometer Pt 0.3 0 5 10 15 20
6. 5 Snodar Surface layer NOn-Doppler Acoustic Radar Bonner et al. (2009) Preliminary Result