Daytime DIMM Observation at Dome Fuji
Daytime DIMM Observation at Dome Fuji. Hirofumi Okita Ph.D student of Tohoku University 52 nd Japan Antarctic Research Expedition, Observer 29 June 2011, SCAR AAA meeting. Introduction: Why A ntarctica ?. airglow emission.

Daytime DIMM Observation at Dome Fuji
E N D
Presentation Transcript
Daytime DIMM Observation at Dome Fuji Hirofumi Okita Ph.D student of Tohoku University 52nd Japan Antarctic Research Expedition, Observer 29 June 2011, SCAR AAA meeting
Introduction: Why Antarctica? airglow emission • We are interested in Infra-red astronomy. However, it is difficult to observe infra-red rays from the ground. • airglow emission • thermal emissions from the atmosphere and from a telescope • strong absorption lines of water vapor exist thermal emissions Visible Infra-red There are minimum sky background and water absorption at the coldest and the driest (highest) site on the Earth. Cox 1999 Sky background emission transparency Antarctic plateau wave length Cox 1999 Water absorption
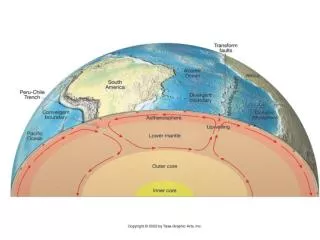
Introduction: Dome Fuji • Dome Fuji is one of the peaks of the Antarctic plateau and • located at 77o19’ 01’’S 39o42’12’’ E, which is 1,000km inland from Showa Station. • The altitude is 3,810m and it is the second highest next to Dome A (4,093m). • The annual average temperature at the station is -54.4oC, and the lowest temperature ever recorded was -79.7oC • Dome Fuji is one of the best site for • Infra-red Astronomy. Excellent seeing may be exist above the surface boundary layer (~15m?). (Saunders et al.2009, Swain&Gallee 2006) • Get higher resolution the location of Dome Fuji We want to know Dome Fuji’s potential for Astronomy.
52nd Japan Antarctica Research Expediton 12 Jan 2011 – 29 Jan 2011 Summer Observation ・PWV (infra-red fiber spectrograph) ・Cloud covering (all-sky camera) ・daytime infra-red Sky background (AIRT40 + TONIC2) ・daytime DIMM (AIRT40 + interlace video camera) Winter- over Observation ・Twin CAM ・16m weather tower (Pt thermometers & ultra-sonic anemometer) ・Snodar ・HR-CAM2 ・PLATO-F
Seeing Seeing is a parameter that describes how blurry a star image will be. It is caused by atmospheric turbulence and is the apparent angular diameter of a point source measured in arcsecond. http://subarutelescope.org It is important to choice the site because thespatial resolution is decided by seeing.
DIMM -outline- The DIMM (Differential Image Motion Monitor) which is now broadly used for site testing over the world is a technique to measure seeing using a small telescope. Atmosphere above the telescope disturb the wave front of the star right. DIMM get 2 images of the same star on the detector(s) which throw different pass in the atmosphere. (we used wedge prisms on the front of the apertures) For Kolmogorov turbulence theory, the deviation of the relative position of these images correlate to the seeing. (Tatarski 1997, Dierickx 1988)
DIMM -theory- longitudinal transverse The Deviation of the images were measured on the longitudinal direction and the transverse direction, we can get 2 values of the seeing simultaneously. σ2: deviation of the relative position of stars λ: wavelength r0: Fried parameter D: Aperture Diameter d: separation two aperture θ: seeing Note: This “l” and “t” directions are defined not images position, but 2-apartures position!
Tohoku DIMM -overview- Tohoku DIMM is “2 pair 2-aperture DIMM” These 2 DIMMs intersect at right angle, so “l” seeing of the vertical set equal to “t” seeing of the horizontal set. horizontal pair vertical pair We get 4 seeing value simultaneously, θvl θvt θhl θht The atmosphere as in the Kolmogorov theory, these 4 seeing values are the same, or θvl = θht and θvt = θhl in the strong wind. We compare these 4 seeing for accuracy of the observation.
Tohoku DIMM -hardware- Okita et al. 2010 WAT-100N (Watec Co., Ltd.) Min. 0.001 lx, and Exp. time/gain/gamma Manually changeable Expose time: 1/1000s
Tohoku DIMM -software- DIMM Observation Software was Developed by Dr. Motohara(University of Tokyo). UT-DIMM with Dr.Motohara @Atakama Motohara’s Software Motohara’s Software uses 30 frames to calculate the variance of the images, and converts the seeing value per 3 second (it depends on CPU power). WAT-100N is a interlace video camera and it takes 30 shots per a second. Its exposure time is manually controllable, and we set 1/1000sec.
Tohoku DIMM -pipeline- Motohara’s software we can get “temporary” seeing. This seeing don’t consider the zenith angle of the star. We made some software for zenith angle correction and other correction. Raw data (image files) ↓ Motohara’s Software ↓ convert from “JST” to “UTC”, “MJD” ↓ zenith angle correction ↓ get 4 seeing value (θvl, θvt, θhl, θht) ↓ → → PRE correction check the value, and calculate the statistical information ↓ ↓ ↓ get final data(histogram, mean, median, expected value, and standard deviation)
Accuracy of Tohoku DIMM To check the seeing value is reasonable or not, we compare Tohoku DIMM with Hiroshima Univ. DIMM. Hiroshima Univ. DIMM 13 Jul 2008, 4hours 3 Oct 2008, 4hours 9 Oct2008, 7hours 13 Oct 2008, 6hours →Good agreement (left)Tohoku-DIMM inside the astronomical dome, (right) Hiroshima Univ. DIMM
Observation We carried out DIMM observation from 25 Jan 2011 to 28 Jan 2011(LST). We used Canopus.(α Car, -0.72mag, δ-52o) ~2m Telescope was set up at snow surface, the hight of aperture ~ 2m First we can’t get the star images because of the strong scattering light by the sun. Thus we covered AIRT40 with cooking-foil. Because the cooking-foil is very thin (10μm) and made by aluminum, we thought this cover was hard to warm and it was minimum to make a local turbulence inside the telescope.
Data reduction (1) First, we converted from JST to MJD, and corrected zenith angle. After, we checked these four data. (θvl, θvt, θhl, θht) But,,, Vertical pair Red: θvl Green: θvt Horizontal pair Red: θhl Green: θht Obviously θhl is different from θht at all time!(and in fact, there are θvl≠ θhtandθvt≠θhl) We thought this cause was not the wind effect but the instrumental problem.
Data reduction (2) Our DIMM use wedge prisms to divide star light on the detector. These prisms are required to set correctly for Motohara’s Software. Longitudinal direction is originally defined the line connect 2-apartures and its orthogonal line as a transverse direction. However Motohara’s software defines the line which is connect 2 star images as a longitudinal. If the prisms are not set correctly, “l” and “t” seeing are not accurate. transverse aperture plane We can correct this error using rotation matrix. We say this error “Prism Rotation Error (PRE)”. longitudinal φ detector plane longitudinal If there is no prism, telescope makes only one image. The prism bents the light and make two images on the detector.
Data reduction (3) Best fit of PRE = 0.12 radian These are the histogram of the θht and θhl. Before PRE correction, there are not same distribution. After this correction, θht and θhl are almost the same. After PRE correction, we define the seeing value and accuracy of this seeing, Typical → good agreement
Result (1) LST (UTC+3) 0 6 12 18 24 Jan 25th Jan 26th Jan 27th Jan 28th
Result (2) Δbin = 0.01” ほんとはフィッティング曲線無しで)
Two log-normal fitting We fit sum of multiplelog-normal distributions, Aristidi et al. 2010 says that Dome C seeing is matched three log-normal, but the Best fit of our data is two log-normal. a1=0.22 μ1=-0.34 σ1=0.19 a2=0.78 μ2=0.22 σ2=0.32 0.72” +/- 0.14” (22%) 1.3” +/- 0.43” (78%)
Discussion 0.72” +/- 0.14” (22%) 1.3” +/- 0.43” (78%) Good seeing appears at afternoon, and Bad one appears at night. These are the same trend to Aristidi et al. 2005, 2006, 2010 (Dome C) which say the minimum at 17 o’clock and the strong temperature gradient makes strong turbulent at night. The value 0.72” is reasonable since this DIMM observation carried out at only 2m height above snow surface. No data: bad weather condition or instrumental accident
Future work Seeing, CT2, and temperature gradient Green: seeing Red: CT2 Blue: Temperature gradient We are now starting to compare DIMM with 16m weather tower (6 Ptthermometers & 2 ultra-sonic anemometers) and Snodar. The weather tower give us the information about the temperature gradient, CT2, wind speed, and wind direction. Snodar gets CT2 of the distribution and the thickness of the boundary layer .
Acknowledgements JARE 51/52 Dome Fuji Traverse Team Thanks for All 51st/52ndJapanese Antarctic Research Expedition members.