Download
1 / 51
550 likes | 887 Views
Explore crystal structures, unit cells, and atomic arrangements in metallic crystals like FCC, BCC, and HCP. Learn about coordination numbers, atomic packing factors, and how to calculate atomic radii in different crystal systems.

E N D
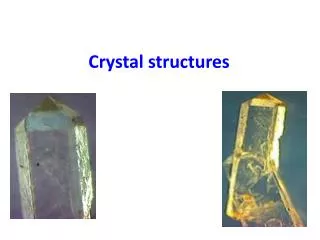
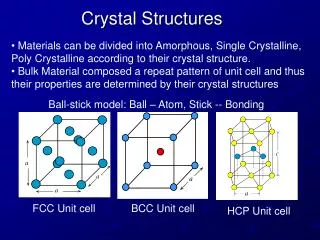
Crystallinity: Repeating or periodic array over large atomic distances. 3-D pattern in which each atom is bonded to its nearestneighbors Crystal structure: the manner in which atoms, ions, or molecules are spatiallyarranged.
Unit cell: small repeating entity of the atomic structure. The basic building block of the crystal structure. It defines the entire crystal structure with the atom positionswithin.
Lattice: 3D array of points coinciding with atom positions (center ofspheres)
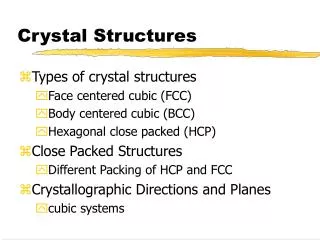
Metallic CrystalStructures FCC (face centered cubic): Atoms are arranged at the corners and center of each cube face of thecell.
FCCcontinued Close packed Plane: On each face of thecube Atoms are assumed to touch along face diagonals. 4 atoms in one unitcell. a2R 2
BCC: Body CenteredCubic • Atoms are arranged at the corners of the cube with another atom at the cubecenter.
BCCcontinued • Close Packed Plane cuts the unit cube inhalf diagonally • 2 atoms in one unitcell 4R 3 a
Hexagonal Close Packed(HCP) • Cell of an HCP lattice is visualized as a top and bottom plane of 7 atoms, forming a regular hexagon around a central atom. In between these planes is a half- hexagon of 3atoms. • There are two lattice parameters in HCP, a and c, representing the basal and height parameters respectively. Volume 6 atoms per unitcell
Coordination number – the number of nearest neighbor atoms or ions surrounding an atom orion. For FCC and HCP systems, the coordination number is 12.For BCC it’s 8.
Close PackedStructures HCP FCC
Atomic PackingFactor • The ratio of atomic sphere volume to unit cell volume, assuming a hard spheremodel. • FCC = HCP = 74% (26% void space in unitcell) • BCC =68%
Problem1 • If the atomic radius for Pb= 0.175nm, find the volume of the unitcell. a2R2 • Solution: Pb is fcc,hence R =0.175nm a = 0.495nm Volume for cubic = a^3 = 1.21e-28m^3
Problem2 Magnesium is hcp with c/a =1.624, density = 1.74g/cm^3. Find the atomic radius ofmagnesium. Solution: density = n*MW /(Vc*NA) For hcp n =6 Vc = .6*(1.624)a^3 =4.22a^3 c =1.624a NA = 6.02*10^23 atoms/mol MW magnesium = 24.3g/mol =2
Problem 2continued 4.22a^3= (6*24.3g/mol)/(1.74g/cm^3*6.02e23atom/mo l) a= 320 pm For hcp a =2R R (atomic radius) magnesium = 160pm
Crystallographic Points, Directionsand Planes • Directions
References • Callister, William D., and David G. Rethwisch. Fundamentals of Materials Science and Engineering: an Integrated Approach. Hoboken, NJ: John Wiley & Sons, 2008.Print. • Gonczy, Steve. MMAE 468 Lecture Notes. Lesson 3: Crystals. Fall2010. • "DoITPoMS TLP - Lattice Planes and Miller Indices - How to Index a Lattice Plane." Dissemination of IT for the Promotion of Materials Science (DoITPoMS). Web. 17 Nov.2010. • <http://www.doitpoms.ac.uk/tlplib/miller_indices/lattice_index.php>. • Wikipedia.com
Phase Diagrams Microstructure and Phase Transformations in Multicomponent Systems • Definitions and basic concepts • Phases and microstructure • Binary isomorphous systems (complete solid solubility) • Binary eutectic systems (limited solid solubility) • Binary systems with intermediate phases/compounds • The iron-carbon system (steel and cast iron)
Component - chemically recognizable species (Fe and C in carbon steel, H2O and NaCl in salted water). A binary alloy contains two components, a ternary alloy – three, etc. Phase – a portion of a system that has uniform physical and chemical characteristics. Two distinct phases in a system have distinct physical or chemical characteristics (e.g. water and ice) and are separated from each other by definite phase boundaries. A phase may contain one or more components. A single-phase system is called homogeneous, systems with two or more phases are mixtures or heterogeneous systems.
Definitions: Solubility Limit Solvent - host or major component in solution, solute - minor component Solubility Limit of a component in a phase is the maximum amount of the component that can be dissolved in it (e.g. alcohol has unlimited solubility in water, sugar has a limited solubility, oil is insoluble). The same concepts apply to solid phases: Cu and Ni are mutually soluble in any amount (unlimited solid solubility), while C has a limited solubility in Fe.
Microstructure The properties of an alloy depend not only on proportions of the phases but also on how they are arranged structurally at the microscopic level. Thus, the microstructure is specified by the number of phases, their proportions, and their arrangement in space. This is an alloy of Fe with 4 wt.% C. There are several phases. The long gray regions are flakes of graphite. The matrix is a fine mixture of BCC Fe and Fe3C compound.
Phase diagrams will help us to understand and predict the microstructures Equilibrium and Metastable States A system is at equilibrium if at constant temperature, pressure and composition the system is stable, not changing with time. Equilibrium is the state that is achieved given sufficient time. But the time to achieve equilibrium may be very long (the kinetics can be slow) that a state along the path to the equilibrium may appear to be stable. This is called a metastable state.
In thermodynamics the equilibrium is described as the state of system that corresponds to the minimum of thermodynamic function called the free energy. Thermodynamics tells us that: • Under conditions of a constant temperature and pressure and composition, the direction of any spontaneous change is toward a lower free energy. • The state of stable thermodynamic equilibrium is the one with minimum free energy. • A system at a metastable state is trapped in a local minimum of free energy that is not the global one.
Phase diagram A phase diagram - graphical representation of the combinations of temperature, pressure, composition, or other variables for which specific phases exist at equilibrium. For H2O, a typical diagram shows the temperature and pressure at which ice (solid),water (liquid) and steam (gas) exist.
Phase diagrams show what phases exist at equilibrium and what phase transformations we can expect when we change one of the parameters of the system (T, P,composition). We will discuss phase diagrams for binary alloys only and will assume pressure to be constant at one atmosphere. Phase diagrams for materials with more than two components are complex and difficult to represent.
Binary Isomorphous Systems (I) Isomorphous system - complete solid solubility of the two components (both in the liquid and solid phases). Three phase region can be identified on the phase diagram: Liquid (L) , solid + liquid (α +L), solid (α ) Liquidus line separates liquid from liquid + solid Solidus line separates solid from liquid + solid
Binary Isomorphous Systems (II) Example of isomorphous system: Cu-Ni (the complete solubility occurs because both Cu and Ni have the same crystal structure, FCC, similar radii, electronegativity and valence).
Binary Isomorphous Systems (III) In one-component system melting occurs at a well-defined melting temperature. In multi-component systems melting occurs over the range of temperatures, between the solidus and liquidus lines. Solid and liquid phases are in equilibrium in this temperature range.
Interpretation of Phase Diagrams For a given temperature and composition we can use phase diagram to determine: 1) The phases that are present 2) Compositions of the phases 3) The relative fractions of the phases Finding the composition in a two phase region: 1. Locate composition and temperature in diagram 2. In two phase region draw the tie line or isotherm 3. Note intersection with phase boundaries. Read compositions at the intersections. The liquid and solid phases have these compositions.
The Lever Rule Finding the amounts of phases in a two phase region: 1. Locate composition and temperature in diagram 2. In two phase region draw the tie line or isotherm 3. Fraction of a phase is determined by taking the length of the tie line to the phase boundary for the other phase, and dividing by the total length of tie line The lever rule is a mechanical analogy to the mass balance calculation. The tie line in the two-phase region is analogous to a lever balanced on a fulcrum.
The Lever Rule WL = S / (R+S) = (Cα - Co) / (Cα- CL) Wα = R / (R+S) = (Co - CL) / (Cα- CL) Mass fractions:
Derivation of the lever rule • All material must be in one phase or the other: • Wα + WL = 1 • 2) Mass of a component that is present in both phases equal to the mass of the component in one phase + mass of the component in the second phase: • WαCα + WLCL = Co • 3) Solution of these equations gives us the Lever rule. • Wα = (Co - CL) / (Cα- CL) WL = (Cα - Co) / (Cα- CL)
Phase compositions and amounts. An example. Co = 35 wt. %, CL = 31.5 wt. %, Cα = 42.5 wt. % Mass fractions: WL = (Cα - Co) / (Cα- CL) = 0.68 Wα = (Co - CL) / (Cα- CL) = 0.32
Development of microstructure in isomorphous alloys Equilibrium (very slow) cooling • Solidification in the solid + liquid phase occurs gradually upon cooling from the liquidus line. • The composition of the solid and the liquid change gradually during cooling (as can be determined by the tie-line method.) • Nuclei of the solid phase form and they grow to consume all the liquid at the solidus line.
Development of microstructure in isomorphous alloys Non-equilibrium cooling • Compositional changes require diffusion in solid and liquid phases • Diffusion in the solid state is very slow. ⇒ The new layers that solidify on top of the existing grains have the equilibrium composition at that temperature but once they are solid their composition does not change. ⇒ Formation of layered (cored) grains and the invalidity of the tie-line method to determine the composition of the solid phase. • The tie-line method still works for the liquid phase, where diffusion is fast. Average Ni content of solid grains is higher. ⇒ Application of the lever rule gives us a greater proportion of liquid phase as compared to the one for equilibrium cooling at the same T. ⇒ Solidus line is shifted to the right (higher Ni contents), solidification is complete at lower T, the outer part of the grains are richer in the low-melting component (Cu). • Upon heating grain boundaries will melt first. This can lead to premature mechanical failure.
Mechanical properties of isomorphous alloys Solid solution strengthening
Binary Eutectic Systems (I) alloys with limited solubility
Binary Eutectic Systems (II) Three single phase regions (a – solid solution of Ag in Cu matrix, b = solid solution of Cu in Ag marix, L - liquid) Three two-phase regions (a + L, b +L, a+b) Solvus line separates one solid solution from a mixture ofsolid solutions. Solvus line shows limit of solubility
Binary Eutectic Systems (III) Eutectic or invariant point - Liquid and two solid phases co-exist in equilibrium at the eutectic composition CE and the eutectic temperature TE. Eutectic isotherm - the horizontal solidus line at TE.
Binary Eutectic Systems (IV) Eutectic reaction – transition between liquid and mixture of two solid phases, a + b at eutectic concentration CE. The melting point of the eutectic alloy is lower than that of the components (eutectic = easy to melt in Greek). At most two phases can be in equilibrium within a phase field. Three phases (L, a, b) may be in equilibrium only only at a few points along the eutectic isotherm. Single-phase regions are separated by 2-phase regions.
References • Callister, William D., and David G. Rethwisch. Fundamentals of Materials Science and Engineering: an Integrated Approach. Hoboken, NJ: John Wiley & Sons, 2008.Print. • Gonczy, Steve. MMAE 468 Lecture Notes. Lesson 3: Crystals. Fall2010. • "DoITPoMSTLP - Lattice Planes and Miller Indices - How to Index a Lattice Plane." Dissemination of IT for the Promotion of Materials Science (DoITPoMS). Web. 17 Nov.2010.