Download
1 / 3
30 likes | 50 Views
This second assignment is the projectu2019s final part, with the main goal of designing an interactive visualization solution to a given scenario, prior chosen by the student. A list of the available scenarios can be found on Moodle. <br><br>The report should contain a detailed description of the chosen design prototype of the data visualization software interface related to your project. The main goal is to detail and explain how the given problem is solved using the proposed system.

E N D
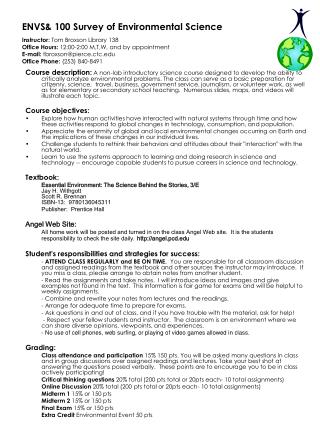
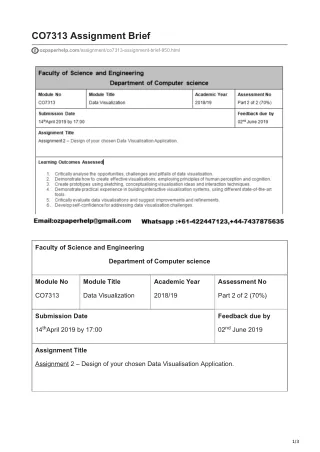
CO7313 Assignment Brief ozpaperhelp.com/assignment/co7313-assignment-brief-950.html Faculty of Science and Engineering Department of Computer science Module No Module Title Academic Year Assessment No CO7313 Data Visualization 2018/19 Part 2 of 2 (70%) Submission Date Feedback due by th nd 14 April 2019 by 17:00 02 June 2019 Assignment Title Assignment 2 – Design of your chosen Data Visualisation Application. 1/3
Learning Outcomes Assessed 1. Critically analyse the opportunities, challenges and pitfalls of data visualisation. 2. Demonstrate how to create effective visualisations, employing principles of human perception and cognition. 3. Create prototypes using sketching, conceptualising visualisation ideas and interaction techniques. 4. Demonstrate practical experience in building interactive visualisation systems, using different state-of-the-art tools. 5. Critically evaluate data visualisations and suggest improvements and refinements. 6. Develop self-confidence for addressing data visualisation challenges. Submission Information Thiswritten assignment must be submitted online via Moodle Turnitin submission. This written assignmentmust be completed in either Microsoft Word format (.docx) or as a PDF (.pdf). Information presented within the report should be concise, with supporting current and relevant evidence that must be referenced and cited using the APA referencing system. Grammar, spelling and punctuation should all be used correctly throughout. The word count equivalent for this written assignment is 2800 - 3850 words. Extensions and Plagiarism Extensions Extensions can only be granted by Dr Linda Rayner, Head of Departmentat least 48 hours in advance of the deadline (by appointment through the Departmental Administrator), and written evidence will be required. Late work is penalised at the rate of 5% per day. Plagiarism The material you submit must be your own work. The penalties for plagiarism are severe. The minimum penalty is usually zero for that piece of work. Further information is available at Portal > Support Departments > Academic Quality Support Services > Academic Malpractice Excessive word count will be penalised according to University Regulations. Assignment Brief Note that the submission consists ofa single document only. Images should be embedded within the text as necessary. Written Report on the Theory of Prototyping a Data Visualisation Interface 2800-3850 words 2/3
This second assignment is the project’s final part, with the main goal of designing an interactive visualization solution to a given scenario, prior chosen by the student. A list of the available scenarios can be found on the Moodle. The report should contain a detailed description of the chosendesign prototype of the data visualization software interface related to your project. The main goal is to detail and explain how the given problem is solved using the proposed system. The written report needs to contain brief descriptions of the following topics: Motivation of choosing the current design– why this one? Pros and cons? Limitations? (500 words) Challenges (encountered and addressed) – how complex problems were dealt with by using the software? Are these approaches optimal? (1000 words) Solution – details about arriving to a solution, which part/element of the software was used for what particular problem? (1000 words) Discussion – further comments and future work. (300 words) 3/3