Download
1 / 1
10 likes | 119 Views

E N D
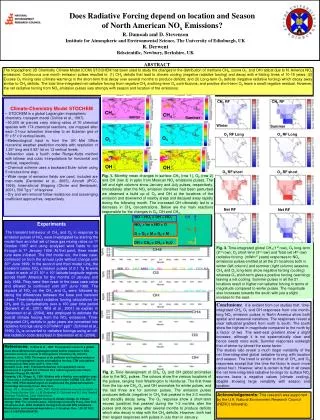
The tropospheric 3D Chemistry Climate Model (CCM) STOCHEM has been used to study the changes in the distribution of methane CH4, ozone O3 and OH radical due to N. America NOx emissions. Continuous one month emission pulses resulted in: (1) CH4 deficits that lead to climate cooling (negative radiative forcing) and decay with e-folding times of 10-15 years; (2) Excess O3 mixing ratio (climate warming) in the short-term that decay over several months to produce deficits; and (3) Long-term O3 deficits (negative radiative forcing) which decay away similar to CH4 deficits. The total time-integrated net radiative forcing from negative CH4 andlong-term O3 contributions, and positive short-term O3 leave a small negative residual. However, the net radiative forcing from NOx emission pulses vary strongly with season and location of the emissions. Climate-Chemistry Model STOCHEM • STOCHEM is a global Lagrangian tropospheric chemistry- transport model (Collins et al., 1997). • 50,000 air parcels carry mixing ratios of 70 chemical species with 174 chemical reactions, are mapped after each 3 hour advection time-step to an Eulerian grid of 5o x 5o x 9 vertical levels. • Meteorological input is from the UK Met Office numerical weather prediction models with resolution of 1.25o long and 0.83o lat on 12 vertical levels. • Advection uses a fourth order Runge-Kutta method with bilinear and cubic interpolations for horizontal and vertical, respectively. • Chemical scheme uses a backward Euler solver using 5 minutes time step. • Wide range of emission fields are used, included are man-made (Dententer et al., 2005), Aircraft (IPCC, 1999), International Shipping (Olivier and Berdowski, 2001), 500 Tg y-1 of isoprene • Dry and wet removal follow resistance and scavenging coefficient approaches, respectively. CH4 RF CH4 RF CH4 CH4 winter Summer Winter Summer O3 RFLong O3 RFLong O3 O3 OH OH O3 RFshort O3 RFshort Net RF Net RF Fig. 1. Monthly mean changes in surface CH4 (row 1), O3 (row 2) and OH (row 3) in ppbv from Mexican NOx emissions pulses. The left and right columns show January and July pulses, respectively. Immediately after the NOx emission densities had been perturbed we observed a build up of O3 and OH at the locations of the emission and downwind of nearby areas and decayed away rapidly during the following month. The increased OH ultimately led to a decrease in CH4 concentrations. Below are the main reactions responsible for the changes in O3, OH and CH4. Fig. 3. Time-integrated global CH4 (1st row), O3 long-term (2nd row), O3 short-term (3rd row) and Total net (4th row) radiative forcing (mWm-2 years) responses to NOx emissions pulses emitted at all the 21 locations both in winter (left column) and summer (right column) seasons. CH4 and O3 long-term show negative forcing (cooling) whereas O3 short-term gives a positive forcing (warming) leaving a net cooling. Summer pulses in all the 21 locations result in higher net radiative forcing in terms of magnitude compared to winter pulses. The magnitude also increases towards the south with just a slight increase to the east. o Experiments The transient behaviour of CH4 and O3 in response to emission pulses of NOx were investigated by starting the model from an initial set of trace gas mixing ratios on 1st October 1997 and using analysed wind fields to run through to 1st January 1998. At that point, three model runs were initiated. The first model run, the base case, continued on from the annual cycle without change until 30th June 1999. In the second and third model runs, the transient cases, NOx emission pulses of 0.1 Tg N were added in each of 21 10o x 10o latitude-longitude regions across North America for the months of January and July 1998. They were then reset to the base case value and allowed to continued until 30th June 1999. The impacts of NOx on the CH4 and O3 were followed by taking the differences between the base and transient cases. Time-integrated radiative forcing calculations for CH4 and O3 perturbations over a 100 year time period (Derwent et al., 2001; Wild et al., 2001) as explain in Stevenson et al. (2004), was employed to estimate the overall climate forcing from the NOx emissions. Time-integrated CH4 deficits in ppbv years are converted into radiative forcings using 0.37mWm-2 ppb-1 (Schimel et al., 1996). O3 is converted to radiative forcings using an off-line radiation code described in Stevenson et al. (2004). Fig. 2. Time development of CH4, O3 and OH global anomalies due to the NOx pulses. The colours show the various locations of the pulses, ranging from Washington to Honduras. The first three from the top are CH4,O3 and OH anomalies for winter pulses, and the last three are for summer pulses. The emission pulses produces deficits (negative) in CH4 that peaked in the 2-3 months and steadily decay away. The O3 response show a short-term excess (positive) that peaked during the 1-2 months after the pulses and decay away after several months to produce deficits which also decay in step with the CH4 deficits. However, both had their largest responses with pulses in July than in January. Conclusions:It is evident from our studies that time-integrated CH4,O3 and OH responses from one month-long NOx emission pulses in North America show both spatial and seasonal variations. The responses reveal a clear latitudinal gradient from north to south. The south show the highest in magnitude compared to the north by a factor of two. The west-east gradient show a slight increase, although it is not systematically clear and hence needs more work. Summer responses outweigh that of winter by almost the same factor. The studies also reveal a much larger variability of the net time-integrated global radiative forcing with location and season. The trend is similar to that of CH4 and O3 responses except that this time the factor is much more (about four). However, what is certain is that in all cases the net time-integrated radiative forcings for surface NOx sources leave a negative values (climate cooling), despite showing large variability with season and location. Acknowledgements: This research was supported by the U.K. Natural Environment Research Council (NERC) fellowship. NO + HO2= OH + NO2 OH NO2 + hv = NO + O O3 O + O2 + M = O3 + M OH + CH4 = CH3 + H2O CH4 References:Collins et al., 1997. Tropospheric ozone in a global-scale three-dimensional Lagrangian model and its response to NOx emission controls. Journal of Atmospheric Chemistry 26, 223-274. Dentener, et al., 2005. The impact of air pollutant and methane emission controls on tropospheric ozone and radiative forcing: CTM calculations for the period 1990-2030. ACP 5, 1731-1755. Derwent, et al., 2001. Transient behaviour of tropospheric ozone precursors in a global 3-D CTM and their indirect greenhouse effects. Climatic Change 49, 463-487. Edwards, J.M., Slingo, A., 1996. Studies with a flexible new radiation code. I. Choosing a configuration for a large-scale model, QJRMS 122, 689-719. IPCC, 1999. IPCC special report on aviation and the global atmosphere. Cambridge University Press, New York. Olivier, J.G.J., Berdowski, J.J.M., 2001. Global emissions sources and sinks. In: The Climate System. Eds. J.J.M. Berdowski, R. Guicherit and B.J. Heij. Swets& Zeitlinger Publishers, Lisse, Netherlands. Schimel et al., 1996. Radiative forcing of climate change, In: Climate change 1995: The scientific basis. Cambridge University Press, New York. Stevenson et al., 2004. Radiative forcing from aircraft NOx emissions: Mechanisms and seasonal dependence, J. Geophys. Res., 109, D17307, doi:10.1029/2004JD004759.. Does Radiative Forcing depend on location and Season of North American NOx Emissions? R. Damoah and D. Stevenson Institute for Atmospheric and Environmental Science, The University of Edinburgh, UK R. Derwent Rdscientific, Newbury, Berkshire, UK ABSTRACT UM+STOCHEM Results