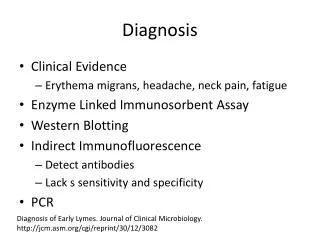
Download

1 / 9
90 likes | 224 Views
Diagnosis II. Dr. Brent E. Faught, Ph.D. Assistant Professor Faculty of Applied Health Sciences Brock University St.Catharines, ON, Canada. Conditional Probabilities. Gold Standard. (D + ). (D - ). True Positive. False Positive. (T + ). Clinical Test. False Negative. True

E N D
Diagnosis II Dr. Brent E. Faught, Ph.D. Assistant Professor Faculty of Applied Health Sciences Brock University St.Catharines, ON, Canada
Conditional Probabilities Gold Standard (D +) (D -) True Positive False Positive (T +) Clinical Test False Negative True Negative (T -)
Interpretation of Diagnostic Data (D +) (D -) P (T + D +) P (T + D –) (T +) A B OR A / (A + C) B / (B + D) C D (T -)
Interpretation of Diagnostic Data (D +) (D -) P (T – D +) P (T – D –) (T +) A B OR C / (A + C) D / (B + D) C D (T -)
Interpretation of Diagnostic Data (D +) (D -) (A + D) (T +) A B C D (T -)
Interpretation of Diagnostic Data (D +) (D -) P ( D + T +) (T +) A B OR __A__ C D (T -) (A + B)
Interpretation of Diagnostic Data (D +) (D -) P ( D - T -) (T +) A B OR __D__ C D (T -) (C + D)
Revising Estimates of Diagnostic Test Performance (D +) (D -) 1. Select an arbitrary sample size. 2. Based on prevalence, calculate the diseased individuals. (T +) 76 4 228 1292 3. Calculate the disease-free individuals. 4. Calculate D + based on fixed sensitivity. (T -) 5. Calculate D - based on fixed specificity. 1600 80 1520
Effect of Prevalence on Predictive Values Prevalence (%)