Download
1 / 45
460 likes | 613 Views
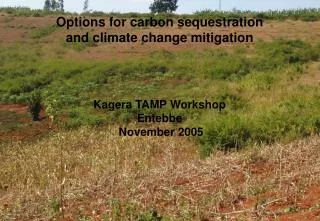
Fire, Carbon, and Climate Change. Fire Ecology and Management 12 April 2013. Overview. Climate change (brief overview of concepts) Climate change – potential effects Wildland fires Fire ecology Carbon cycle (brief overview of relevant terminology) Local and global fire-C interactions.

E N D
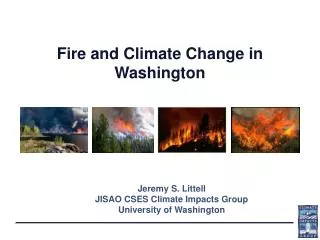
Fire, Carbon, and Climate Change Fire Ecology and Management 12 April 2013
Overview • Climate change (brief overview of concepts) • Climate change – potential effects • Wildland fires • Fire ecology • Carbon cycle (brief overview of relevant terminology) • Local and global fire-C interactions
Climate change • Definition Climate change refers to any significant change in the measures of climate lasting for an extended period of time. In other words, climate change includes major changes in temperature, precipitation, or wind patterns, among others, that occur over several decades or longer. -U.S. Environmental Protection Agency
Climate change • Definition • Causes
Climate forcing – internal vs external • Internal forcing mechanisms • Example: Plant life • Example: Greenhouse effect - Thermohaline circulation
Climate forcing – internal vs external • External forcing mechanisms • Example: Orbital variations • Example: Solar output
Climate change • Definition • Causes • Effects
Climate change • Definition • Causes • Effects • Evidence
Problem: • We have only limited information about the complex suite of factors driving wildfires… (Result: highly complex models that aren’t yet perfect) Implied question: • Can we reconstruct complex system dynamics from a limited amount of information?
Analogy from other complex systems to fire? • Example: Lorenz Atmospheric Convection Model δx / δt = σ ( y – x ) δy/δt = ρx – y - xz δz/δt = -βz + xy
Analogy from other complex systems to fire? • Example: Lorenz Atmospheric Convection Model δx / δt = σ ( y – x ) δy/δt = ρx – y - xz δz/δt = -βz + xy
Reconstructing system dynamics from limited information: • Application of Takens’s Theorem (1981): • Time-lag embedding can be used to reconstruct system dynamics given only a limited amount of information. Lorenz data sequence (top) courtesy of Prof. Eric Weeks, Emory University Department of Physics
SSA - SV Decomposition Decomposes time series into sum of additive components • Trajectory matrix construction • Singular Value Decomposition (SVD) • Grouping of SVD components • Reconstruction by diagonal averaging = eigenvalue, = eigenvector of = eigenvector of , See: T. ALexandrov and N Golyandina “the_autossa_files_AutoSSA-slides-EN”
Diagnostic Strategy [Original data set] Test for Spectral Stationarity [e.g., Short-time Fourier Transform] Signal-Noise Separation Deterministic Signal Unstructured Noise Surrogate Data Analysis iid, AAFT, PPS Surrogates Attractor Reconstruction Surrogate Data Analysis iid, AAFT Surrogates Extreme Value Statistics
Output -Correlation dimension: indicator of stable attractor -Low CD and difference in surrogated vs original data indicate “chaotic dynamics” -No difference appearance of chaos due to periodicity or noisy linear dynamics -Lyapunov exponent: indicator of sensitivity to initial conditions -Surrogate data analysis tests the hypothesis that apparent structure is due to stochastic processes, rather than deterministic ones
Application of SSA - NLTSA to Fire Prediction Potential advantages: -Could detect trends AND “hidden” deterministic structure -Detection of chaotic behavior sensitivity to initial conditions obvious problems for prediction -Forecasting implications: Predictions based on dynamical behavior, prior data Analytical technique to “validate” structure of other model output Different method: possible new insights
Analysis of Fire Data using SSA - NLTSA Preferences for initial analysis: -Multiple sites with diverse climates/fire seasons -Few “confounding factors” to introduce additional noise: Low level of intervention (e.g. tree harvests) No human-caused fires (i.e. arson, Rx)
Analysis of Fire Data using SSA - NLTSA Preferences for initial analysis: -Multiple sites with diverse climates/fire seasons -Few “confounding factors” to introduce additional noise: Low level of intervention (e.g. tree harvests) No human-caused fires (i.e. arson, Rx) Occurrence (i.e. # of fires by month) vs. # Acres Burned -preliminary analysis indicated occurrence data preferable
Dataset: US NPS Fire Data, 1980-2010 Florida* 11 Properties 2.4M acres Year-round fires Alaska*: 23 Properties 52.6M acres Limited fire season *Both of interest due to potential GCC/fire interactions Maps: University of Texas
Dataset: US NPS Fire Data, 1980-2010 Florida* 11 Properties 2.4M acres Year-round fires Alaska*: 23 Properties 52.6M acres Limited fire season *Both of interest due to potential GCC/fire interactions http://linda.ullrich.angelfire.com/Alaska.html OrlandoSentinel
Data preparation - Screened NPS fire data set (41K+ fires) AK and FL fires - AK: 491 natural ignitions in 30y; FL: 1245 natural wildfires
Preliminary SSA for spectral trend detection • -Quasi-oscillatory behavior; low signal:noise • -De-trending not necessary
Data analysis I: NLTS-SDA Nonlinear dynamics, presence of attractor
Data analysis I: NLTS-SDA Sensitivity to initial conditions
Data analysis I: PSR visualization Alaska Fire Occurrence Florida Fire Occurrence
Data analysis I: PSR visualization Alaska Fire Occurrence Florida Fire Occurrence
Data analysis II: SSA; hindcasting Florida Fire Occurrence, hindcast/forecast
Data analysis II: SSA; hindcasting Alaska Fire Occurrence, hindcast/forecast
Initial Findings: Summary -Nonlinear, deterministic structure detected in fire occurrence data -Chaotic dynamics also detected in fire occurrence data (i.e. sensitivity to initial conditions) -SSA hindcasting reproduces some structure of original data (but misses “extreme” episodes)
Some Implications -Use to ask: Do forecasts of future fire scenarios possess similar “hidden” dynamics? -Initial-conditions sensitivity a concern for forecasting -Shows potential for applicability in forecasting
Next Steps -Re-analyze using occurrence-size index -Additional subregions (including other global regions) -Incorporation of climate or environmental data to reduce noise -Larger and “noisier” datasets (e.g., USFS) -General improvements to occur with increased learning
Acknowledgments Fire Data: Andy Kirsch, Nate Benson: USNPS Funding: JFSP/AFE (GRIN Award) University of Florida Alumni Foundation Contact: acwatts@ufl.edu
Alaska Hindcasting/Forecasting Phenomenon: Increased periodic amplitude based on more-recent data:
Forecast based on first 100 observations Alaska Fire Occurrence, hindcast/forecast (using first 100 observations)
Forecast based on first 120 observations Alaska Fire Occurrence, hindcast/forecast (using first 120 observations)
Forecast based on first 140 observations Alaska Fire Occurrence, hindcast/forecast (using first 140 observations)