Download
1 / 22
220 likes | 376 Views
long-term fiscal projections under alternative labour force scenarios. Peter Gardiner, Matthew Bell & Paul Rodway. The usual disclaimer.

E N D
long-term fiscal projections under alternative labour force scenarios Peter Gardiner, Matthew Bell & Paul Rodway
The usual disclaimer... The views, opinions, findings and conclusions or recommendations expressed in this paper are strictly those of the authors. They do not necessarily reflect the views of the NZ Treasury or the New Zealand Government. The New Zealand Treasury take no responsibility for any errors or omissions in, or for the correctness of, the information contained in this paper. The paper is presented not as policy, but with the view to inform and stimulate wider debate.
Overview • Motivation • Long-term fiscal strategy • Growth assumptions • Labour force participation • Hours worked • Labour productivity • Fiscal and revenue projections • Discussion - limitations and future work
Motivation – Treasury’s Long-Term Fiscal Strategy • Accompanying the yearly budget, Fiscal Strategy Report provides a further 10 years of fiscal projections that provide key indicators like net debt and operating balance • In 2006 and again in 2009 produced longer term projections (Long Term Fiscal Statement) to 40-50 years • Highlight the implications of demographic change, namely population ageing • The Treasury are in the early stages of planning the LTFS that is scheduled to be released in early 2013 • This work was undertaken to inform the LTFS
Motivation – FTFS & LTFM • Long-term fiscal projections aren’t forecasts (although they are follow from the Treasury forecasts) • They are based on a set of aggregate-level assumptions and do not incorporate any policy responses. • However, they do portray potential paths for important fiscal indicators under current or planned policy settings • Key assumptions that under underpin LTFM • Future participation rates based on Statistics NZ’s population projections • Hours worked and labour productivity (and inflation) projections are based on their respective historical averages • We are explicit about the impact that an ageing population will have in these key labour market assumptions – ie that it will cause a fall in labour force participation, but will not alter hours worked or labour productivity This work looks at how to incorporate ageing effects more broadly...
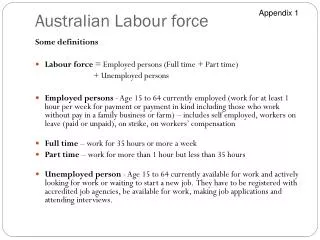
Labour force projections • Based on Statistics New Zealand’s Series 5 projection • From which the Treasury derives a projected working age population (15+). • Using the SNZ census-based labour force projections as a base the Treasury derive five-year age group labour force participation rate projections • These are blended with aggregate level participation rate forecasts from Treasury’s macroeconomic forecasts to capture initial business cycle effects • Age group participation measures to drive forward the projections for 40 years.
Labour force projections Labour force participation rates by age group, male and female...
Labour force projections • The total labour force participation rate can be broke into a component due to the working age population structure and a component reflecting the participation performance within each age group as follows: Structure component + Performance component
Average Hours Worked Until recently, hours worked has been reasonably stable... Age group profile highlights gender differences and lower hours worked among youth and older workers
Projecting age-augmented hours worked (weighted average total that accounts for changes in population structure) Where k is the age group, g is gender and WAP is the working age population. With no projected employment by age group, working age population projections are used as a proxy, while average hours worked by age group and sex are based on historical averages. provides an approximation of average hour worked that accounts for changes in the projected population structure. Projected Average hours worked: base and adjusted by age
Labour productivity • Little NZ based analysis that has looked at the impact of NZ’s ageing population on productivity... • Internationally seems be a general acceptance that on some level ageing is correlated with declining productivity - largely based on health science studies that report a decline in non-cognitive skills with age among individuals. • Although opponents argue that it is difficult to link to productivity and ageing because: • there’s no strong evidence that demonstrates that cognitive skills decline with age and that worker productivity depends on many factors including the extent to which cognitive skills are relevant to specific jobs • Furthermore others argue that population ageing causes shifts in both labour supply and demand for goods and services, for which the outcome, in terms of economy-wide productivity, is indeterminate.
Labour productivity • The question whether it’s reasonable to assume that ageing and productivity are linked is aptly summarised in “Economic Implications of an Ageing Australia” by the Australian Productivity Commission (2005). It suggests that differences in assumed projected growth rates arise from two sources: • Different views about the effects of ageing on productivity • Different views about economy-wide productivity changes that are not directly linked to ageing • General approach is to use wage distributions to approximate productivity differences across age groups and to adjust for changes in population structure to capture ageing effects on labour productivity
Projecting age-augmented labour productivity • Mincer wage equations is estimated to approximate relative differences in labour productivity across age groups and gender, controlling for education and year. Depends on link between growth in real wages and labour productivity... ...Some NZ evidence supports this
Projecting age-augmented labour productivity • Wage profiles are used to derive relative productivity differences by age and gender weighted by working age population to average labour productivity growth of 1.5%. Labour productivity projections don’t account for changes to age group productivity... ... rather they reflects changes in the structure of the population
Fiscal and revenue projections • Central to the Treasury’s projections are estimates of both real GDP and nominal GDP (inflation projections) – the key assumptions above drive much of the revenue and expenditure projections • The Treasury restricts current policy effects to just the five-year forecast horizon and then require policy to be “neutral.” • The net result of modelling projections is best summarized by four key fiscal indicators: • Core Crown Revenue (%GDP): • Core Crown Expenses, excluding finance costs (%GDP): • Core Crown Debt (%GDP): • Total Crown OBEGAL (%GDP): Operating Balance excluding Gains and Losses
Fiscal and revenue projections • Projection assumptions: • PREFU 2011 base and two alternative age-augmented: • Labour productivity only • Labour productivity and hours worked
Fiscal and revenue projections Primary balance (%GDP) • primary balance; (Core crown revenue - investment income) less (expenditure – debt-financing costs), • shows a more modest decline compared to the OBEGAL projection
Discussion, limitations and future work • This exercise has been useful in underlining a number of factors that should be addressed if we are to incorporate wider population ageing effects when modeling the impact of population ageing on fiscal projections. • It highlights that the main channel of future population ageing occurs through labour force participation • And that while the impact on hours worked and labour productivity may be modest - they do have fiscal implications that could be important to incorporate more formally in the Treasury’s LTFM
Discussion, limitations and future work • Several methodological and data issues need to be resolved, including: • Labour force projections: Independent labour force projections are needed to generate more realistic participation rates beyond the initial 20 year projection horizon. Because of the way that age group labour force estimates are projected the decline in the aggregate projected labour force participation rate may be overstated. • Employment: Labour force projections should disaggregated - employment • 65+ age group: Age groups could be extended to 65-69 and 70+ to better and more accurately account for the changes in labour force participation that that are occurring among the older age groups. • LTFM: While labor productivity is incorporated in the LTFM, this exercise has highlighted that more thought could needed to better accounting for hours worked in the model.
Discussion, limitations and future work • This work has also highlights some deficiencies in the adopted approach. • The approach accounts for structural changes in New Zealand’s population including in participation. • Supply-side methodology that doesn’t include likely feedback loops. For example, doesn’t account for changes in demand for goods and services, or account for changes to age group hours worked or labour productivity that may be the consequence of population ageing • On a positive note, Statistics NZ recently published experimental stochastic population projections for New Zealand (See Dunstan, 2011). This methodology could be a useful innovation that may resolve some of the issues identified above, if extended to age groups and labour force projections, and would also provide measures of uncertainty • Given existing data limitations, this methodology is unlikely to be adopted in the main LTFM projections, although it could be presented as part of the alternative scenarios that accompany the central projections
Thank you... • Questions?