Download
1 / 30
300 likes | 452 Views
Statistical Considerations for Population-Based Studies in Cancer I Special Topic: Statistical analyses of twin and family data. Kim-Anh Do, Ph.D. Associate Professor Department of Biostatistics Email: kim@mdanderson.org http://odin.mdacc.tmc.edu/~kim.

E N D
Statistical Considerations for Population-Based Studies in Cancer ISpecial Topic: Statistical analyses of twin and family data Kim-Anh Do, Ph.D. Associate Professor Department of Biostatistics Email: kim@mdanderson.org http://odin.mdacc.tmc.edu/~kim
The usual idea of a gene is a specific region of DNA that codes for a single protein or enzyme, and the position of a gene on a chromosome is its locus. • The basis for research by human geneticists is to try to identify traits, or phenotypes, whose inheritance patterns are consistent with the action of individual genes. • Recent advances in genetics show that the relationship between DNA sequence and phenotype is both more complex and more interesting than we thought. • Some functions of DNA do not even depend on its nucleotide sequence, and DNA sequence variation includes a variety of direct and indirect forms of feedback among variousregions of the DNA within and between cells.
Allele and genotype frequenquencies • The most fundamental quantitative variable in population genetics is the allele frequency, a prevalence measure. • When a locus has only two alleles, denote their frequencies p and q=1-p. • Let Pg define the frequency of genotype g • The frequency of an i homozygote is Pii = pi pi = pi 2 • The frequency of an ik heterozygote is Pik = 2 pi pk • For a diallelic system the genotypes have frequency • PAA = p2 PAa = 2pq Paa = q2
Frequenquency relationships between genotype and phenotype • The concept of penetrance • A given genotype does not always produce the same phenotype. The association between the two is known as the penetrance. • Individuals with a given genotype will have some distributionof phenotypes; the penetrance function specifies the probability that an individual with genotype g has phenotype • g() = Pr(|g)
Frequenquency relationships between genotype and phenotype (cont’d) • For many quantitative biological traits there is some measurement scale on which the phenotypes are approximately normally distributed. • g() = {1/[g (2)]} exp[-(-g)2 / 2g2 • Penetrance is a statistical, population-specific association between genotype and phenotype, not a biological explanation of such a relationship. • Many factors may affect the expression of a given genotype: genes, environmental factors, errors in measurement or classification, sampling error etc.
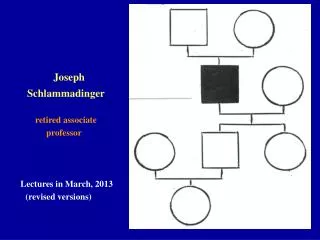
Nuclear families and sibships • The distribution of traits in families • A diploid, sexually reproducing organism has two sets of genes, one inherited from each parent. • Each time that individual produces his/her own gamete (sperm or egg), one of his/her inherited alleles, at each locus, will be randomly chosen and transmitted in the gamete. There is thus a probability of ½ that an offspring will inherit a specific parental allele. THIS probabilistic aspect of inheritance IS A FUNDAMENTAL ASPECT OF OUR BIOLOGY.
Segregation analysis: discrete traits in families • We can understand the basic principles of genetic epidemiology by studying the behavior of alleles at a single locus in nuclear families. • We can take advantage of evolution-based constraints on the distribution of genetic variation in families. • The analysis of trait distributions in families is known as segregation analysis after Gregor Mendel’s Law of Segregation of individual alleles at a locus. • The idea is to judge if the pattern of phenotypes in families is consistent with a genetic model. • Families are ascertained via one or more index individuals, or probands, who may be either randomly identified, or chosen because of their disease or other phenotype status.
Nuclear families and sibships • The distribution of traits in families • A diploid, sexually reproducing organism has two sets of genes, one inherited from each parent. • Each time that individual produces his/her own gamete (sperm or egg), one of his/her inherited alleles, at each locus, will be randomly chosen and transmitted in the gamete. There is thus a probability of ½ that an offspring will inherit a specific parental allele. THIS probabilistic aspect of inheritance IS A FUNDAMENTAL ASPECT OF OUR BIOLOGY.
Nuclear families and sibships (cont’d) • Transmission probabilities • For a single diallelic locus with alleles A and a, define the transmission probabilities t(x|g), as the probability that a parent of genotype g produces a gamete with allele a. These are conditional probabilities because they depend on the genotypic state of the parent. • For autosomal loci • t(A|AA) = 1, • t(A|Aa) = ½, • t(A|aa) = 0.
Table 5.1A. Genotypic mating table for an autosomal diallelic locus
Nuclear families and sibships (cont’d) • Mating types • The probability that an individual has a given genotype is determined by the genotype, or mating types, of its parents • A nuclear family is a set of repeated selections of offspring genotypes from the mating type, Mk l, of parents with genotypes k and l. • In a population (or sample), • 0 <= Pr(Mk l) <= 1 ; k l Pr(Mk l) = 1; est(Mk l)= nk l/N. • If there is random mating relative to the locus in question, the mating type frequencies are determined by the genotype frequencies (determined by the allele frequencies)
Nuclear families and sibships (cont’d) • Transition probabilities • Family data consists of parent-offspring triads. • Define transition probabilities P(go|gf , gm) as the conditional probabilities of genotypes in offspring given those in the father and mother. • For a diallelic locus, there are three possible offspring genotypes (AA, Aa, aa) with transition probabilities • t(A|f) t(A|m) • t(A|f) (1- t(A|m)) + t(A|m) (1- t(A|f)) • (1 - t(A|m)) (1- t(A|f)) • See Table 5.1B
Table 5.1B. Parent to offspring transition probabilities for a diallelic locus
Table 5.2. Phenotypic mating table for an autosomal diallelic locus
Segregation analysis: discrete traits in families (con’t) Ascertainment bias and correction: sibship data • The way in which families are ascertained can have major effect on the interpretation we make of the data. • Example: Ascertain affected children through the school system. Collect data on all siblings of affected. • Suppose the segregation proportion (alsp the prob that a rnadom offspring is affected) is . The probability that a family of sibship size s produces r affected children follows a binomial distribution • Pr(r|s, ) = s!/[r!(s-r)!] r (1- )(s-r) • Therefore the probability that such a family will produce s normal children is (1- )s. • These families will never be identified if we ascertain • sibships through affected school children.
Ascertainment bias and correction: sibship data (con’t) • Must correct for ascertainment to obtain unbiased estimates. • One simple way: recognize that our sample contain all families, except those with no affecteds, I.e. our sample represents a fraction [1- (1- )s] of thetotal population of sibships in this example. • The corrected probabilities of r affected from a family of size s • Pr(r|s, ) = s!/[r!(s-r)!] r (1- )(s-r) / [1- (1- )s] . • Another way of ascertainment correction is to perform analyses ignoring the affected probands. This is acceptable only if the probability that a given affected child is ascertained is small. • Other ascertainment problems: Families with many affecteds may have a higher chance of being ascertained by a given sampling scheme. • Corrections for some simple sampling situations have long been known in medical genetics, but methods for complex situations are still inexact.
Segregation analysis: quantitative traits in families • Quantitative traits may be affected by a large number of loci acting together, as well as by environmental factors. • Examples of important disease related traits: • Blood pressure; obesity measures; • cholesterol; triglycerides. • We need to understand the effect of the genotypes, and the environment, on the phenotype. • The effects of genotypes on quantitative phenotypes are relative: Does phenotype AA increase the phenotype, or does aa decrease it?
Segregation analysis: quantitative traits in families • The simplest measure of genetic effect is the genotypic value, the mean phenotype observed amongst individuals with a given genotype in the population of reference • g = i i g(i) • The mean number of doses of a given allele, say A, in genotypes in a population is • g = 2 p2 + 2pq (1) + q2 (0) = 2p • The mean phenotype in the population is the weighted average = g Pg g • = p2 AA + 2pq Aa + q2 aa • for a diallelic locus
Genetic variation for a quantitatitve trait • The genotypic variance is defined as the variance among the genotypic values in the population: • g2 = Pg (g - )2 = Pg g2 - 2 • = 2pq • It is often convenient to express genotypic values as deviations from the population mean denoted by • g = g - • In the simplest situation, the effects of the individual alleles are additive, and the genotypic value is the sum of the effects of the two alleles in the genotype.
Genetic variation for a quantitatitve trait (cont’d) • Define i to be the allelic value that each allele contributes to the genotype. Since allele A is paired with another A a fraction p of the time, and with a for q of the time, we have • A = pAA + qAa • a = pAa + qaa • Special characteristic of effects expressed as deviations: Their average over all genotypes must be zero, I.e • pA + qa = 0. • When the allelic effects are additive, the breeding value, or average deviation, of genotype ik is I +k.
Genetic variation for a quantitatitve trait (cont’d) • Define the additive genotypic variance,2A , as the sums of squares of the breeding values, weighted by the genotype frequencies • 2A = p2 (2A)2 + 2pq (A + a )2 + q2 (2a)2 • = 2(p 2A + q2a) • Define the dominance displacement d as the position of the heterozygote relative to the two homozypotes • d = (Aa - aa) / (AA - aa) • If the effects are purely additive, the heterozygote genotypic value will be exactly halfway between those of the homozygote, I.e. d=1/2. • The dominance variance is the variance due to dominance deviations from additivity and equals • 2D = p2 (AA - 2A)2 + 2pq (Aa - A -a )2 + q2 (aa - 2a)2
Environmental effects on quantitative phenotypes • Environmental factors are responsible for within genotype variance. The simplest way to account for environmental variance is to aggegate all unmeasured effects on the phenotype, usually assuming that they have a normal distribution. • We can now express the determination of the phenotype as a sum of additive genetic, dominance, and environmental effects • = A + D + E • with variance • 2 = 2A + 2D+ 2E • The environmental effects can ge additive, I.e. act similarly on each genotype, or there can be a genotype by environment (G E) interaction if the same environmental exposure affects different genotypes differently (add 2GE to the above equation).
Kinship and inbreeding coefficients: probabilities of shared genes • Several quantities are used to measure the genetic relationship between two individuals. • The coefficient of kinship, FXY, between individuals X and Y, is the probability that two alleles at the same locus, one chosen randomly from each individual, are identical by descent (ibd) from some common ancestor. • The inbreeding coefficient , F, is the probability that his/her two alleles at a locus are ibd. This equals the kinship coefficient of its parents. • The coefficient of relationship,r = 2 FXY , is the fraction of genes shared ibd by two individuals. • Table 6.2 gives kinship F coefficients for various important kinds of relative pair.
Table 6.2 (Weiss) Genetic relationships among various types of relative
Genotypic correlation between relatives • Consider the genotypic values of parents and offspring, for an additive diallelic locus. See Table 6.3. • For a locus with three genotypes, there are nine possible parent-offspring genotype pairs. • Example: First row of table. • The probabilities of an AA father and an AA, Aa, or aa child are p, (1-p), 0 respectively, because: • Note that all offsprings receive an A from father with probability 1, so offsprings cannot have genotype aa. • All offsprings receive an A from the father, and an A from the mother with prob p (making their genotype AA); or an a from their mother with prob 1-p (making their genotype Aa).
Table 6.4 (Weiss) Components of genetic covariance for various types of relative
The covariances between any pair of relatives, P and Q, can be expressed as a weighted combination of additive and dominance effects. • Let the parents of P be denoted by A nd B. • Let the parents of Q be denoted by C and D. • Cov(P,Q) = rPQ2A + uPQ2D • where uPQ = FAC FBD + FAD FBC • F values are kinship coeficients given in Table 6.2.
Extension to multiple loci: polygenic traits • Fisher, 1918, showed that the single-locus genetic relationships among relatives were preserved for multiple additive loci. • Example: • At a single locus, there are 3 genotypes (AA, Aa, aa) and three genotypic dose values (0, 1, and 2). • At two such loci, there are nine genotypes (aabb, aabB, aaBB, aAbb,aAbB, aABB, AAbb, AAbB, AABB) and 5 different genotypic values (0, 1, 2, 3, 4). • In general, for n such loci there are 3n genotypes and 2n+1 genotypic values, i.e., as n gets large, the distribution of additive genotypic values resembles the continuous distribution of a quantitative trait. • In practice, the distribution of summed additive effects can be approximated by a normal distribution. The genotypic correlations between relativesalso hold for multiple additive loci.
Extension to multiple loci: polygenic traits (con’t) • Dominance refers to non-additive (interaction) effects between alleles at the same locus. • Epistasis refers to interactions among alleles at different loci. This adds another term to the expression for the determination of the phenotype • = PG + E = A + D + I + E • with variance • 2 = 2PG + 2E = 2A + 2D+ 2I + 2E • which can be rewritten as • 1 = 2PG /2 + 2E /2 • Define heritability as h2 = 2PG /2 . Heritability represents the ratio of the observed phenotypic correlation to the theoretical genotypic correlation. • In twins: h2 = (2DZ - 2MZ ) / 2DZ