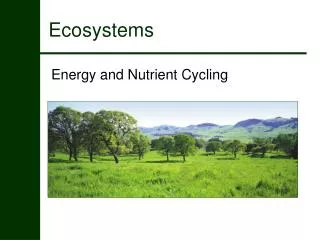
Understanding Ecosystems: Key Components, Species Interactions, and Measurement Techniques
520 likes | 619 Views
This comprehensive overview of ecosystems explores their biotic and abiotic components, highlighting species interactions, such as the American black bear (Ursus americanus). It delves into measurement techniques for ecological assessments, including the Lincoln Index for estimating populations and Simpson’s Diversity Index for evaluating ecosystem health. Additional topics include productivity metrics like Gross and Net Primary Productivity, the significance of biodiversity, and methods for measuring environmental factors such as temperature and salinity.

Understanding Ecosystems: Key Components, Species Interactions, and Measurement Techniques
E N D
Presentation Transcript
Introduction • Species (be…specific!) • Bear: not good • American Black bear: great • Ursus americanus: amazing • Population • Community • Ecosystem • Habitat • Niche
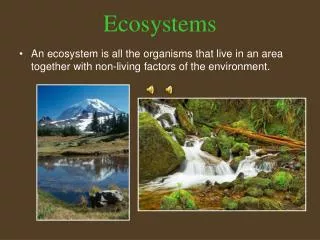
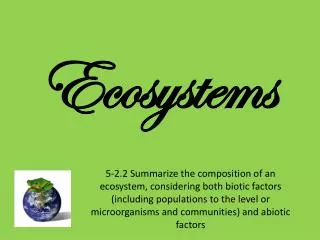
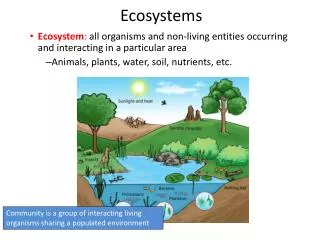
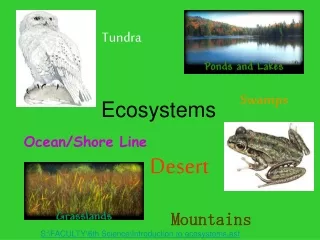
All ecosystems have two sets of components. • Biotic • Living things • How they interact • Relationships • Abiotic • Light • Temperature • Soil • Turbidity • Wind speed • Dissolved oxygen • Slope • Salinity • Flow rate • Elevation • pH • Wave action
How do you measure biotic components? • Identify the species • Use a dichotomous key • Estimate the abundance of organisms • Percent cover • Percent frequency • Estimating biomass • The mass of living material • It’s easiest for plants, but it’s destructive
How do you measure biotic components? • We focused mostly on plants. • Animals are harder to measure, why? • There are some simple ways for smaller organisms. • For larger organisms, the Lincoln Index is the easiest way.
Lincoln Index • Scientists capture a sample of individuals, mark them, and release them. • Scientists then return, capture another sample, and estimate the total population
Calculating Lincoln Index • 25 birds caught, tagged, released. 30 birds caught second time, 18 were marked.
Calculating Lincoln Index • 8 elephants caught, tagged, released. 9 elephants caught second time, 6 were tagged.
Calculating Lincoln Index • 200 ants caught, marked, released. 185 ants caught second time, 57 were marked.
Calculating Lincoln Index • 20 blugill caught, tagged, released. 30 bluegill caught second time, 3 were marked.
Lincoln Index Assumptions • Population must be closed, no immigration or emigration • Time between samples must be small compared to the lifespan • Marked organisms must mix with the population after marking
Lincoln Index Setbacks • Capture can injure animal • Mark/tag may harm animal • Mark/tag may be removed • Mark/tag may increase/decrease predators • Different individuals are more/less “capturable” • Individuals may become trap-happy or trap-shy
But it’s not just about HOW MANY living things are in an area. • Diversity is very important as well and is a measure of the health of an ecosystem. • The lower the diversity, the lower the health. • Why do you think this is?
Ecosystem 1 • 15 rats • 13 squirrels • 8 moles • 6 mice • 5 chipmunks
Ecosystem 2 • 0 rats • 10 squirrels • 3 moles • 4 mice • 25 chipmunks
Ecosystem 3 • 16 rats • 0 squirrels • 7 moles • 0 mice • 32 chipmunks
Ecosystem 4 • 3 rats • 24 squirrels • 2 moles • 4 mice • 5 chipmunks
Ecosystem 5 • 10 rats • 10 squirrels • 7 moles • 9 mice • 0 chipmunks
Ecosystem 6 • 85 rats • 0 squirrels • 0 moles • 0 mice • 0 chipmunks
Ecosystem 7 • 3 rats • 13 squirrels • 0 moles • 0 mice • 5 chipmunks
Ecosystem 8 • 0 rats • 13 squirrels • 0 moles • 0 mice • 22 chipmunks
Ecosystem 9 • 15 rats • 15 squirrels • 15 moles • 0 mice • 9 chipmunks
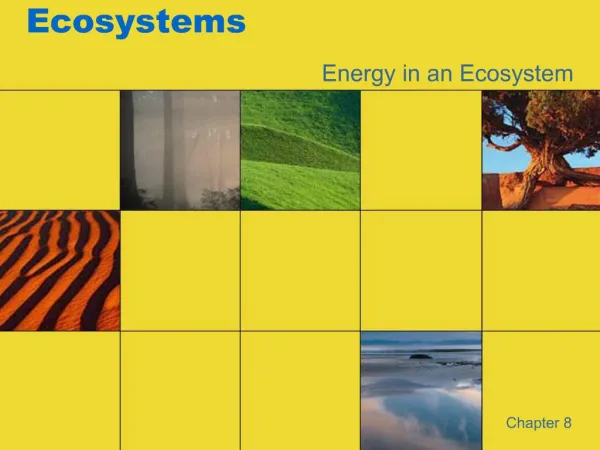
Gross Primary Productivity • The amount of energy produced or amount of mass produced by producers
Net Primary Productivity • The amount of energy or mass that is stored by producers • The amount of energy available to consumers
Gross Secondary Productivity • The total amount of energy consumed by consumers
Net Secondary Productivity • The total amount of mass gained by (primary) consumers
Pyramid of Numbers • Shows the number of organisms at each level. • Good for comparing changes • Bad because numbers can be too great to represent and difficult for organisms at multiple trophic levels
Pyramid of Biomass • Shows the amount of biomass at each level • Difficult to measure biomass, biomass varies over seasons
Pyramid of Productivity • Shows the amount of energy flow through an ecosystem (rule of 10 - each level is about 10% of the previous level) • Good because ecosystems can be compared • Bad because the data is hard to get and species can be at multiple trophic levels.
Measuring abiotic components • Marine Ecosystems: • Salinity • pH • Temperature • Dissolved Oxygen • Wave Action
Measuring abiotic components • Freshwater ecosystems • Turbidity • Flow Velocity • pH • Temperature • Dissolved Oxygen
Measuring abiotic components • Terrestrial ecosystems • Temperature • Light intensity • Wind speed • Slope • Soil moisture • Mineral content
Measuring abiotic components • Best method: • Count the organisms • Next best method: • Capture-Mark-Release-Recapture • (Lincoln Index)
Population Curves • S Curve • Reaches carrying capacity and stabilizes • J Curve • Unchecked population growth
Survivorship • r- strategists • Short generation time • Mature quickly • Small size • Many offspring • Little parental care • Adapted to unstable/ unpredictable environments
Survivorship • K- stragetists • Long life/generation time • Mature slowly • Large size • Few offspring • Parental care • Predictable/stable environments where population stays near carrying capacity
Population Regulation • Density dependent inhibition • Population is regulated by negative feedback • Crowding • Competition
Population Regulation • Density independent inhibition • Weather • Disturbances
Succession • A natural increase in the complexity of the structure and species composition over time • A lifeless area becomes an ecosystem
Bare surface • A lifeless abiotic environment becomes available for pioneer species • Usually r-selected species
Seral Stage 1 • Simple soil starts • Pioneer species adapted to extreme conditions colonize
Seral Stage 2 • Species diversity increases • Organic material and nutrients in soil increases
Seral Stage 3 • Larger plants colonize • K-selected species become established • r-selected species unable to compete get fazed out
Seral Stage 4 • Fewer new species • Narrower niches develop, K-selected species become specialists
Climax Community • Stable and self-perpetuating ecosystem • Maximum development under temperature, light, precipitation conditions.