Download
1 / 28
280 likes | 347 Views
This in-depth analysis compares nuclear power cost estimates from various sources, highlighting major factors influencing the economics. Issues like capital costs, opaque methodologies, subsidies, and long lead times are explored, shedding light on the complexity of nuclear power financial assessments.

E N D
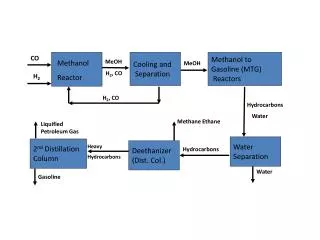
Reactor Economics 2008 Jim Harding National Academy of Sciences/National Research Council Panel January 22, 2008 Washington, DC
How Do Current Estimates Compare? What Factors Are Most Important? • Capital cost is most important • EIA - $2083/kW • MIT - $2000-2500/kW (2003) • Keystone - $3600-4000/kW (June 2007) • S&P - $4000/kW (May 2007) • Moody’s - $5000-6000/kW (October 2007) • FP&L - $5200-7800/kW (Fall 2007) • Operating costs less important but not insignificant • Assumptions and methodology often opaque • Life cycle cost estimates range from 5-17 cents/kWh • Why is this so?
The Easy Reasons – for all resources • Lack of a consistent economic methodology • Capital cost usually stated in mixed current dollars at COD, rather than discounted real dollars • Subsidies often included in cost estimates, though they affect price not cost • Very important for long lead time, capital intensive units • Example: Keystone high case for nuclear was $2950/kW overnight, $4650/kW mixed current dollars at COD, and $4000/kW in discounted 2007 dollars. • All the same number!
Nuclear Power is Tougher • Lack of recent North American nuclear construction experience • Historical reliance on “studies” and vendor software • Studies often reference each other • Software assumes Asian construction practices, and excludes owner’s costs – contingency, escalation, interest during construction, land, transmission, and oversight. Long lead time for recalculating • Little incentive to be accurate or up-to-date; no real money being spent • MIT chose actual Asian values, but assumed no real escalation • Long lead time; licensing, siting, rate recovery and financing uncertainties. Very problematic in states with deregulated retail markets. • Escalation during construction not considered; first of a kind premiums and learning curves instead • Supply-chain imbalances not considered (skilled labor, sub-suppliers) • Transmission costs and lead time usually not considered
Recent Asian Experience Cost data from MIT 2003 Future of Nuclear Power study. Average does not include South Korean units, owing to labor rates. Real escalation from 2002-2007 at 4 percent/year.
Major Keystone Assumptions • Take Asian experience at face value (important) • Escalate at EPRI estimate for heavy construction, 2002-2007 in low case and through COD in high case (very important) • 5-6 year construction period and no major finance or regulatory issues; conventional IOU financing (all very important) • Use current spot prices for uranium, and predicted enrichment prices for long term fuel prices (not very important) • O&M and capacity factor at current fleet average; include decommissioning, capital additions, and A&G; 30-40 year life (somewhat important) • Life cycle cash flows discounted at weighted after tax cost of capital (somewhat important; first year cost – “rate shock” - can be twice as high as levelized life cycle cost) • No major new transmission required (important, but site specific)
Real Escalation is the Biggest Problem Provided to Keystone panel by EPRI
Four Percent Real May Be Too Low Source: American Electric Power
Escalation Likely Worse for Nuclear • Industry moribund in Western Europe, US, and Russia since TMI and Chernobyl • Twenty years ago (US): 400 suppliers, 900 N-Stamp holders; today 80 and 200 • Only one forge for large parts – Japan Steel Works; maybe Creusot Forge (France) • Skilled labor and contractor limits • World uranium production well below current consumption
Recent Estimates • Keystone - $3600-4000/kW; 8-11 cents/kWh • Discounted real 2007 dollars; would be $5600/kW (16-17 cents/kWh) at AEP escalation rate from 2002-COD • Standard & Poor’s - $4000/kW; 9-10 cents/kWh • Basis not stated; levelized fixed charge rate • Life cycle costs reflect Keystone O&M and fuel costs • Moody’s - $5000-6000/kW • Basis not stated; operating and fuel costs not estimated • Florida Power & Light - $5200-7800/kW • Basis not stated; major transmission included
Keystone “Updated” Lifecycle Costs Costs are in real discounted 2007 cents/kWh. Highest high case based on Moody’s capital cost. Low high and low case exclude South Korea.
Life Cycle and Operating Costs Also Vary • Nuclear O&M costs estimates often do not include • A&G costs • Net capital additions • Decommissioning • Nuclear fuel cost estimates often do not include • Current spot prices for uranium • Likely increase in enrichment prices • Life cycle cost estimates often use simplified levelized fixed charge rates rather than more complex discounted cash flows
S & P Assessment - w/ carbon controls Keystone operating costs are used instead of those estimated by S&)
US Projections – Decades Ago Mark Gielecki and James Hewlett, Commercial Nuclear Power in the United States: Problems and Prospects, US Energy Information Administration, August 1994. Data is in 2002 dollars.
US Economics – Two Decades Ago Koomey, Jonathan, and Nate Hultman. 2007. “A Reactor-Level Analysis of Busbar Costs for US nuclear plants,” 1970-2005, forthcoming in Energy Policy
Tom Neff (MIT), Uranium and Enrichment: Enough Fuel for the Nuclear Renaissance?, December 2006.
Jeff Combs, President, Ux Consulting Company, Price Expectations and Price Formation, presentation to Nuclear Energy Institute International Uranium Fuel Seminar 2006
Reprocessing Is Still Expensive Approximately 5.25 kgs of spent fuel must be reprocessed to obtain 1 kg of MOX.
Efficiency and Renewables Can Be Disruptive Technologies A disruptive technology is often cheaper than the operating cost of the existing system Demand is not limited to growth in service Efficiency resources cost less thanoperating costs for existing gas (or coal with carbon taxes); they pay for themselves with +3x more carbon savings per dollar Wind was disruptive from 2002-2005 and may be again Photovoltaics may soon become one Only disruptive energy technologies can grow fast enough to solve climate challenges
Utility Programs Are Also Important Northwest Power Planning Council, Achievable Savings, August 2007
Historical Northwest Utility Programs Northwest Power Planning Council, Achievable Savings, August 2007
Figure 8 -Estimated ENERGY STAR CFL Market Share for the Northwest and U.S., 2000-2006 • Sources: NW CFL sales 2000-2006: PECI and Fluid Market Strategies sales data reports; and NEEA estimate of an additional 1.5 million WAL-MART CFLs sold region-wide in 2006 (See Appendix A [Section 9.1.1] of MPER3 for more detail); U.S. and NW population estimates 2000-2006: U.S. Census 2004; U.S. market shares and non-CFL sales 2000-2005: Itron California Lamp Report (2006); U.S. market share 2006: D&R International (personal communication). Compact Fluorescent Market Penetration
The Bottom Line • Twenty years from light water reactor technology will be roughly the same as it is today • Efficiency resources, wind turbine technology, and photovoltaics are improving rapidly • Take one example --- Nanosolar • started by the Google founders, backed also by Swiss Re • Building two 430 MW/yr thin film PV production facilities this year in Germany and California, using a technology they equate to printing newspapers • Currently shipping and reportedly profitable at $0.99/watt (not including installation and balance of system) • The cheapest, least risk strategy is rapid development of efficiency resources