Download
1 / 11
110 likes | 299 Views
To Jump or Not to Jump Student data-based reasoning. To Jump of Not to Jump. Objective: Study variation in a population of grasshoppers and explain how an environmental stress could affect their population. Grasshopper Anatomy: Measure Femur.

E N D
To Jump of Not to Jump • Objective: Study variation in a population of grasshoppers and explain how an environmental stress could affect their population.
Grasshopper Anatomy:Measure Femur Today we will be studying a population of grasshoppers and how an environmental stress could affect their population. At your table discuss what structures could help the grasshoppers survive?
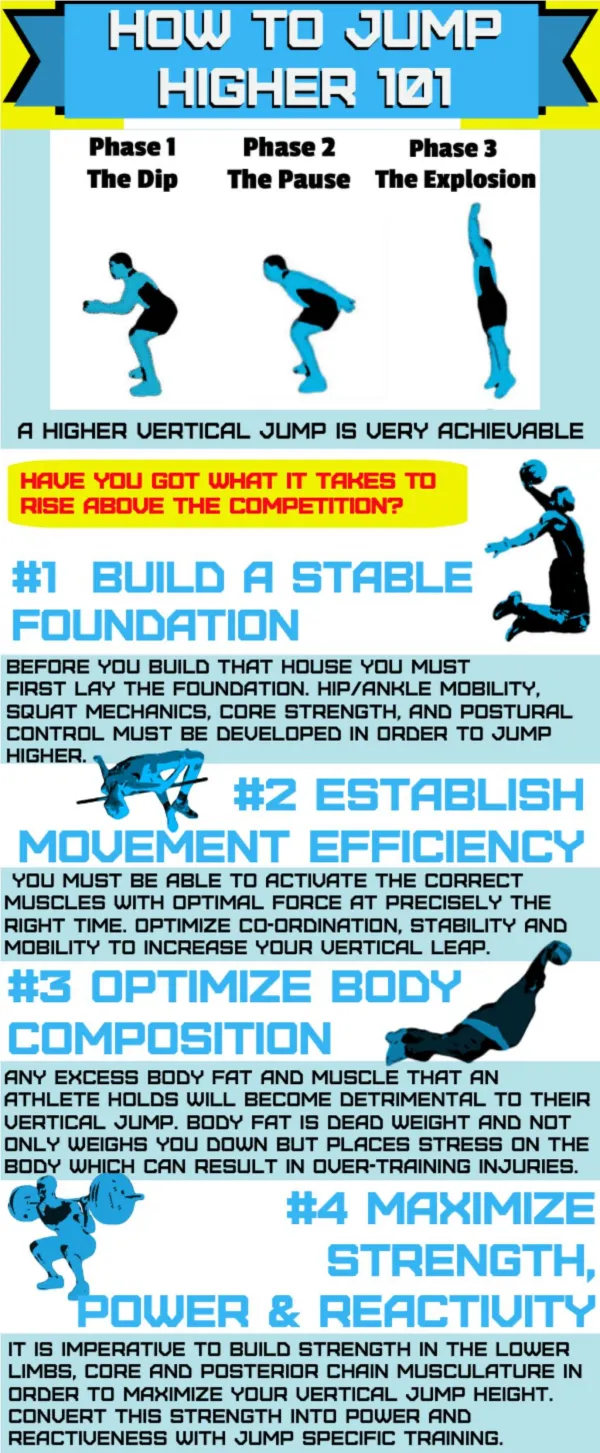
Grasshopper FACTS • Over 18,000 species of grasshoppers all over the world • Grasshoppers can leap 20 times the length of their own bodies. For us, that would mean we could leap 40 yards or about half the length of a football field. • They have 5 eyes: 2 compound eyes, 2 that are located at the base of their antennae and one found in-between the antennae • Spit “tobacco juice” as a defense when picked up
Grasshopper Variation • We are going to look at variation in the length of grasshopper femurs. • How can we measure them? Unit of measurement? (mm) • We will compare all group’s data, so we need to measure the same. • Everyone at the table should measure between 5-10 grasshoppers and record measurements on your group data table. Fill out your worksheet with the summary information (total #, smallest, largest, range) • Write your smallest femur length on one post-it • Write your largest femur length on another post-it
Graphing our DATA • Graph your data on Graph 1: frequency distribution with only 5 bars • Smallest: • Largest: • Bar 1: • Bar 2: • Bar 3: • Bar 4 • Bar 5 • X axis = Y axis=
Part II: FIRE!!! • A large fire has occurred in the grasshoppers habitat. • Predict: What do you think your population will look like after a fire? (#9) • The fire has wiped out 90% of the grasshoppers with femurs less than _____mm. • Cross these grasshoppers off your list • Re-graph your data again with these grasshoppers removed
Explanation • Based on your investigation: Do you think the next generation of grasshoppers will look more like Graph 1 or Graph 2? • Claim: a statement or conclusion that addresses the original question • Evidence: data that support your claim • Appropriate = data are relevant to the problem • Sufficient = enough data to convince someone of the claim • Reasoning: justification that shows why data count as evidence; ties in the scientific content knowledge (standards) (McNeil & Krajcik, 2008)
How can you support students in writing scientific explanations? • Make the Framework Explicit • Understand the terms • What is the difference between evidence and data? • Model and Critique Explanations • Show and critique both good and bad explanation examples: • “The next generation of grasshoppers will look more like Graph 2 because in my first graph most of the grasshoppers died. The data table is my evidence. The grasshoppers with the longest femurs will survive more.” • Get with a partner and critique this explanation
How can you support students in writing scientific explanations? • Provide a Rationale for Creating Explanations • One of the main tenants of science: That is what scientists do—try to explain the world around them. • Need to persuade others of their claims • Build a strong argument to support their claim—relate to everyday explanations • Contrast explaining in everyday life (description) to explanation in science (need for evidence and reasoning)