Download
1 / 20
210 likes | 252 Views
Explore uncertainties in wildfire emission estimates & regional air quality modeling during the workshop on July 30, 2008. Learn about MODIS-DB burned area algorithm, emissions inventories, fuel loading, meteorology, and emission factors.

E N D
Uncertainties in Wildfire Emission Estimates Workshop on Regional Emissions & Air Quality Modeling July 30, 2008 Shawn Urbanski, Wei Min Hao, Bryce Nordgren Missoula Fire Sciences Laboratory, US Forest Service
Wildfire Fire Emission Inventories • The Fire Sciences Laboratory has developed a MODIS-DB burned area algorithm to: • Develop wildfire emission inventories for the western US • Provide ‘rapid response’ wildfire emissions for air quality forecasting/management activities • Demonstrate a prototype smoke dispersion – air quality forecasting system (assimilation of MODIS derived emissions for predicting fire impacts on regional air quality)
Fire Information Fuel Loading Meteorology Consumption Model Emission Factors Emission Estimate Method • Fire Information • MODIS-DB system (Missoula, MT) • 4 daily observation per location • Complete coverage of western US • Combines active fire and burn scar detections – daily burned area at 1-km2 • Fuel Loading • Land cover / fuel map • Fuel loading model (vegetation load by fuel class) Meteorology – analysis / observations Fuel moisture (NFDRS) Consumption Model First Order Fire Effects Model (FOFEM) EMISSIONS
Mass emission of X over Δt : X = A * M *FC * EFX A ( area burned ) detection & area spatial & temporal distribution M (mass of fuel - dry vegetation) land cover map fuel loading model Fc ( fraction of fuel consumed ) fuel consumption model meteorology fuel condition (moisture) EF ( emission factor X kg / kg fuel consumed) fire average or phase specific cover type
Uncertainties Associated with Land Cover and Fuel Loading • Land Cover • Fuel Characteristic Classifications System (FCCS) • CONUS 1-km resolution • 112 cover types • USFS PNW Research Station, McKenzie (2007) • FIA Forest Map • CONUS 250-m resolution • 138 SAF forest types • Non-forested areas use FCCS • USFS Forest Inventory & Analysis program and Remote Sensing Applications Center • Fuel Loading • Fuel Characteristic Classifications System (FCCS) • FCCS fuel loading model • Cross-walk to SAF forest types • FOFEM Reference Database • SAF/SRM cover types • Cross-walk to FCCS • USFS RMRS Missoula Fire Sciences Laboratory
Uncertainties Associated with Land Cover and Fuel Loading Fuel loading uncertainty – Case A vs. Case B Map uncertainty – Case C vs. Case D
Jan-06 Apr-06 Jul-06 Oct-06 Jan-07 Apr-07 Jul-07 Oct-07 Monthly Burned Area Western US 10000 6000 Burned area (km2) 2000 0
Jan-06 Apr-06 Jul-06 Oct-06 Jan-07 Apr-07 Jul-07 Oct-07 Monthly CO Emissions Western US 5000 3000 CO emissions (Gigagrams -CO) 1000 0
B B C C D D A A Annual CO Emissions by Fuel Method 2006 2007 10000 6000 CO emissions (Gigagram) range ~10% range ~20% range in fuel consumption ~10% ~20% 2000 0 FUEL METHOD
B B C C D D A A Annual PM2.5 Emissions by Fuel Method 2006 2007 1500 PM2.5 emissions (Gigagram) 1000 range ~10% range ~20% 500 0 FUEL METHOD
B B C C D D A A Annual NOX Emissions by Fuel Method 400 2006 2007 300 200 NOX emissions (Gigagram) range ~5% range ~20% 100 0 FUEL METHOD
B B C C D D A A Annual Methanol Emissions by Fuel Method 2006 2007 250 200 150 NMVOC ~1-2% of C OVOC 60-70% of NMVOC methanol emissions (Gigagram) 100 range ~10% range ~20% 50 0 FUEL METHOD
B B C C D D A A Annual Formaldehyde Emissions by Fuel Method 300 2006 2007 200 formaldehyde emissions (Gigagram) range ~10% range ~20% 100 0 FUEL METHOD
Fuel Loading Impact on CO emissions 2006 E_CO Metric ton-CO km-2 -270.0 - -168.0 -168.0 - -86.0 -86.0 - -34.0 -34.0 - -7.0 Min = -266 Metric ton km-2 Max = +826 Metric ton km-2 -7.0 - 11.0 11.0 - 52.0 52.0 - 157.0 157.0 - 400.0 400.0 - 850.0
2006 E_PM2.5 Metric ton – PM2.5 km-2 -40.5 - -27.0 -26.9 - -13.1 -13.0 - -5.2 -5.1 - -1.1 -1.0 - 1.6 1.7 - 7.8 7.9 - 23.9 60.5 - 125.3 Fuel Loading Impact on PM2.5 emissions Min = - 41 Metric ton km-2 Max = +125 Metric ton km-2 24.0 - 60.4
2006 E_NOX Metric ton – NOX km-2 -14.8 - -8.5 -8.4 - -3.5 -3.4 - -1.1 -1.0 - -0.2 -0.1 - 0.6 0.7 - 2.3 2.4 - 5.6 5.7 - 11.4 11.5 - 23.7 Fuel Loading Impact on NOx emissions Min = - 15 Metric ton km-2 Max = +24 Metric ton km-2
2007 E_CO Metric ton CO km-2 -545.6 - -332.1 -332.0 - -194.8 -194.7 - -99.0 -98.9 - -41.1 -41.0 - -9.2 -9.1 - 21.8 21.9 - 108.3 108.4 - 324.6 324.7 - 787.8 Land Cover Map Impact on CO emissions Min = - 546 Metric ton km-2 Max = +787 Metric ton km-2
2007 E_PM2.5 Metric ton PM2.5 km-2 -82.8 - -50.4 -50.3 - -29.5 -29.4 - -15.0 -14.9 - -6.2 -6.1 - -1.4 -1.3 - 3.3 3.4 - 16.4 16.5 - 49.2 49.3 - 119.5 Land Cover Map Impact on PM2.5 emissions Min = -83 Metric ton km-2 Max = +120 Metric ton km-2
2007 E_NOX Metric ton NOX km-2 -15.6 - -9.3 -9.2 - -5.4 -5.3 - -2.9 -2.8 - -1.2 -1.1 - -0.3 -0.2 - 0.6 0.7 - 3.0 3.1 - 9.3 9.4 - 22.6 Land Cover Map Impact on NOx emissions Min = -16 Metric ton km-2 Max = +23 Metric ton km-2
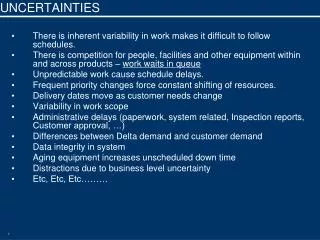
Summary • Choice of land cover map and fuel model have significant impact on emission estimate • Uncertainty in annual emissions for western US: 20% map and fuel model combined 10% map or fuel model alone • Uncertainty varies spatially and temporally • Large regional uncertainties e.g. 30% in MT and ID due to map choice alone, ~ 60% map and fuel model combined Don’t forget burned area, consumption model, & EF’s