Download
1 / 25
250 likes | 383 Views
HIM 3200 Inference and Hypothesis Testing. Chapter Five Session Four Dr. Burton. Standard Deviation. Deductive/Inductive Reasoning. Deductive “to lead out from” General >>>>>>> specific If, then Inductive “to lead into” Specific>>>>>>>general. Math vs. Statistics.

E N D
HIM 3200Inference and Hypothesis Testing Chapter Five Session Four Dr. Burton
Deductive/Inductive Reasoning • Deductive “to lead out from” • General >>>>>>> specific • If, then • Inductive “to lead into” • Specific>>>>>>>general
Math vs. Statistics • Different approach to the same equation: y = mx + b • Math: • b is a constant that stands for the y intercept • m is also a constant that stands for the slope • One of the variables is unknown • The formula and the constants are known • Statistics • The reverse is true • The variables x & y are known for all observations
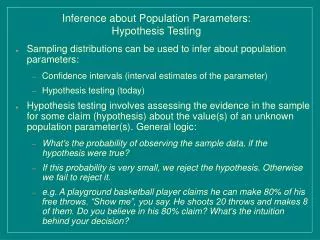
Process of Testing Hypotheses • Test are designed to determine the probability that a finding represents the true deviation from what is expected. • This chapter focuses on the justification for and interpretation of the p value designed to minimized type I error. • Science is based of the following principles: • Previous experience serves as the basis for developing hypotheses; • Hypotheses serve as the basis for developing predictions; • Predictions must be subjected to experimental or observational testing.
Test Statistic A random variable related to the tested hypothesis. Example: the total number of heads when a coin is tossed ten times or the difference between the mean percent reduction n serum cholesterol for the drug versus the placebo.
Level of significance The probability of a type I error; denoted by
Ten tosses of a coinPossible outcomes Heads 0 1 2 3 4 5 6 7 8 9 10 Tails 10 9 8 7 6 5 4 3 2 1 0
Critical Region A set of values of the test statistic leading to rejection of the tested hypothesis; sometimes called the rejection region. For example, 0, 1, 9, 10 heads or a percent difference equal to 5.
Acceptance region. A set of values of the test statistic leading to acceptance of the tested hypothesis, that is the values of the test statistic not included in the critical region. For example, 2,3,4,5,6,7,or 8 heads; any percent difference except 5.
Power The probability of rejecting the tested hypothesis when it is false, that is, when an alternative hypothesis is true; denoted by 1 - where is the probability of a type II error.
P = value The level of significance at which the observed value of the test statistic would just be significant, that is, would just fall into the critical region.
Probabilities of Type I and Type II errors Truth H0 True H0 False Type II Error Correct results Accept H0 Test result 1 - Type I Error Correct results Reject H0 1 - Differences H0 True = statistically insignificant H0 False = statistically significant Accept H0 = statistically insignificant Reject H0 = statistically significant
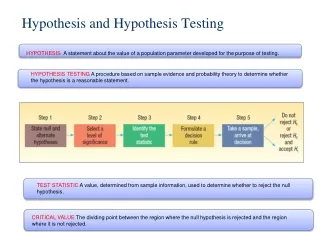
Hypothesis Testing 1. State question in terms of: H0: no difference or relationship (null) Ha: is difference or relationship (alternative) If I were to compare the final exam scores between the Summer session and the Fall session of HIM 3200 how would I state the null and alternative hypothesis?
Hypothesis Testing 1. State question in terms of: H0: no difference or relationship (null) Ha: is difference or relationship (alternative) 2. Decide on appropriate research design and statistic • Select significance (alpha) level and “N” Sometimes called the a priori alpha level. Usually set at p = 0.05 (the probability of a Type I error)
Hypothesis Testing 1. State question in terms of: H0: no difference or relationship (null) Ha: is difference or relationship (alternative) 2. Decide on appropriate research design and statistic • Select significance (alpha) level and “N” • Collect data • Analyze and perform calculation to get P-value • Draw and state conclusions by comparing alpha with P-value
Theoretical normal distribution with standard deviations -3 -2 - +2 +3 + Z scores -3 -2 -1 1 2 3 0 Probability Upper tail .1587 .02288 .0013 Two-tailed .3173 .0455.0027
What is the z score for 0.05 probability? (one-tailed test) 1.645 What is the z score for 0.05 probability? (two tailed test) 1.96 What is the z score for 0.01? (one-tail test) 2.326 What is the z score for 0.01 probability? (two tailed test) 2.576
Three Common Areas Under the Curve • Three Normal distributions with different areas
The Relationship Between Z and X =100 =15
Standard Error • SE is related to the standard deviation • Standard error is the standard deviation of a population of sample means, rather than of individual observations. • Refers to the variability of means rather than individual observations. • SE does two things: • Estimates the probable amount of error around the quantitative assertions. • Performs tests of statistical significance
Converting SD to Standard Error • N =26, X = 113.1 mmHg, SD = 10.3 mmHg • SE = SD/ N = 10.3 / 26 = 2.02 mmHg • 95% CI = mean + 1.96 SE = 113.1 + (1.96) (2.02) = 113.1 + 3.96 = BETWEEN 113.1 –3.96 AND 113.1 + 3.96 = 109.1, 117.1 mmHg
Tests of Statistical Significance Critical ratios are a class of tests Critical ratio = parameter/SE of that parameter t = difference between two means / SE of the difference between two means z = difference between two proportions/SE of the difference between two proportions
Degrees of freedom • N – 1 • If two means are calculated then 2 degrees of freedom are lost. • A degree of freedom is lost every time a mean is calculated.
Chapter Review Question Problem 1. a, b, c, d Table 5-A-2 Pages 150 and 151