Download
1 / 1
Analysis of ATG5 Expression and LC3 Protein Levels in Cell Study
10 likes | 111 Views
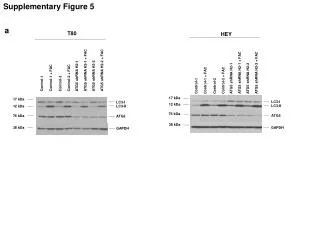
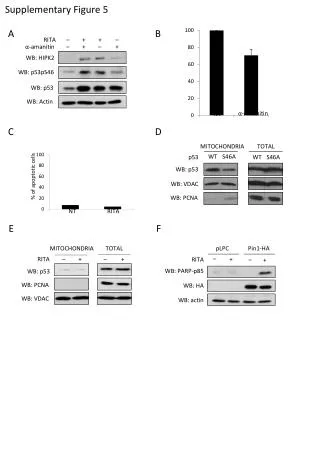
This supplementary figure showcases the impact of ATG5 knockdown on LC3 protein levels in the study, using various experimental conditions and controls. The Western blot results display changes in LC3-I, LC3-II, and ATG5 protein expression, aiding in understanding autophagy regulation.
Download Presentation 
Analysis of ATG5 Expression and LC3 Protein Levels in Cell Study
An Image/Link below is provided (as is) to download presentation
Download Policy: Content on the Website is provided to you AS IS for your information and personal use and may not be sold / licensed / shared on other websites without getting consent from its author.
Content is provided to you AS IS for your information and personal use only.
Download presentation by click this link.
While downloading, if for some reason you are not able to download a presentation, the publisher may have deleted the file from their server.
During download, if you can't get a presentation, the file might be deleted by the publisher.
E N D
Presentation Transcript
Supplementary Figure 5 a T80 HEY ATG5 shRNA H2-1 + FAC ATG5 shRNA H2-2 + FAC ATG5 shRNA H2-1 + FAC ATG5 shRNA H2-2 + FAC ATG5 shRNA H2-1 ATG5 shRNA H2-2 Control-1 + FAC Control-2 + FAC ATG5 shRNA H2-1 ATG5 shRNA H2-2 Control-1 + FAC Control-2 + FAC Control-1 Control-2 Control-1 Control-2 17 kDa 17 kDa LC3-I LC3-I 12 kDa LC3-II LC3-II 12 kDa 76 kDa ATG5 76 kDa ATG5 38 kDa GAPDH 38 kDa GAPDH


More Related