Download
1 / 19
200 likes | 243 Views
Comprehensive analysis of AC/DC flyback dual-output converter prototype implementation with waveform and efficiency assessments, thermal analysis, and design evaluation.

E N D
Hardware Prototype Implementation • Topology: AC/DC Flyback Dual-output Converter • Input range: 85-264VAC/50Hz • Outputs: O/P1 – 5V/6A; O/P2 – 12V/2.5A
Drain Voltage Waveform Analysis • Critical waveforms • Input voltage at 85VAC • Simulation peak voltage from • PowereSim = 300V • Actual peak voltage approx. = 285V • Primary MOSFET switching waveform • Ch1 – M1 drain source voltage waveform; Ch2 – M1 drain current waveform
Bulk Capacitor Voltage Waveform Analysis • Critical waveforms • Input voltage and bulk capacitor voltage waveforms Measurement Simulation • Similar intersection point • Ch1 - Input AC voltage waveform • Ch2 - Rectified bulk capacitor voltage
Input Current Waveform Analysis • Critical waveforms • Input voltage and current Measurement Simulation • Ch1 - Input AC voltage waveform • Ch2 - Input current waveform
Line Regulation Output at full load Measurement Simulation
Load Regulation Input voltage at 85VAC Simulation Measurement
Power Loss Analysis • Efficiency comparison at full load
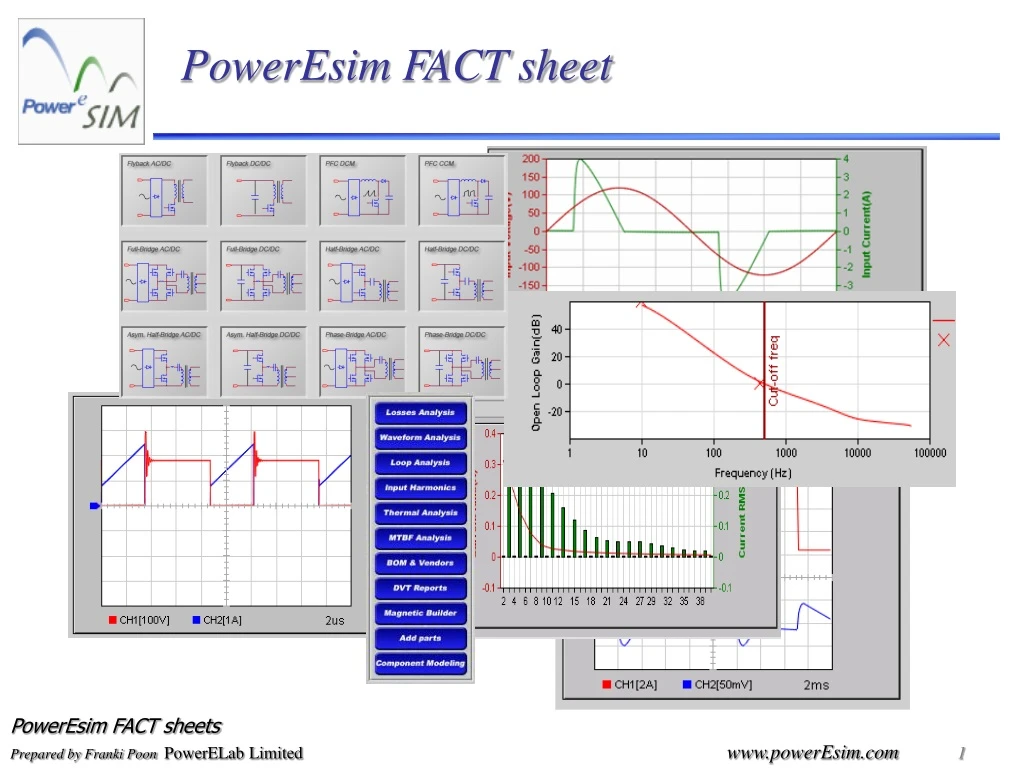
Closed-loop Analysis (Bode plot) Input voltage at 115VAC full load Measurement Simulation Cut-off freq Cut-off freq
Closed-loop Analysis (Transient Response) Measurement Simulation Conditions: Input voltage at 162VDC O/P1: 5V @ 0.2A-6A O/P2: 12V at 1A CH1: Load current CH2: Output voltage of O/P1
Input Current Harmonics Analysis Input voltage at 230VAC/50Hz Measurement Simulated bar charts showed in good agreement with measurement.
Thermal Analysis Measurement Simulation 123.1 103 65 70 78 62 94 68 52 93 94 52 66
Transformer Design Leakage inductance: Measurement = 2.787uH Simulation = 2.982uH
DVT Report – 100 times faster to know the design fault Measurement Simulation
DVT Report – Every component checked include Xformer Measurement Saturation current observed in experimental measurement Simulation
DVT Report – MOSFET Stress Measurement Simulation A simulated drain voltage of 75W flyback converter with 3 outputs – result = ~580V
Evaluation Design Measurement Simulation
After ALL Traditional Engineer Daily Work PowerEsim Engineer Daily Work • Day 1 – start paper calculation • Day 2 – collect data sheets • Day 3 – collect data sheets • Day 4 – find equations • Day 5 – understand equations • Day 6 – start calculation • Day 14 – finish calculation • Day 15 – Bench Work • Day 21 – fs changed • Day 22 – re-calculate design • Day 25 – finish re-calculation • Day 26 – redesign Xformer • Day 27 – MOSFET overstress • Day 28 – redesign Xformer • Day 29 – OP diode overstress • : • Day60 - FINISH • Day 1 – PowerEsim calculation • Day 2 – Bench Work : : Day x – PowerEsim recalculation • : • : • : • : • Day30 - FINISH