Understanding Nuclear Energy: Costs, Safety, and Environmental Impact
This informative overview explores nuclear energy, covering its economic aspects, types of reactors, and environmental implications. It highlights that while nuclear fission produces no air pollution during operation, it generates radioactive waste that requires careful management. The economic analysis reveals nuclear energy's competitive costs compared to other sources. Safety measures, including the U.S. Nuclear Regulatory Commission's protocols, are discussed to ensure public and environmental protection. This comprehensive guide aims to educate readers on the complexities of nuclear power and its role in the energy landscape.

Understanding Nuclear Energy: Costs, Safety, and Environmental Impact
E N D
Presentation Transcript
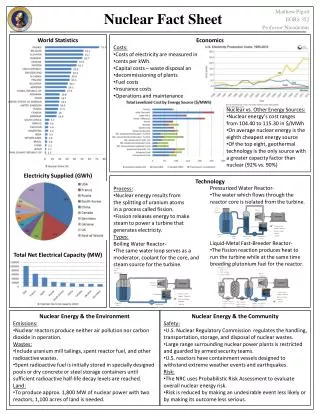
______________________________________________________________________________________________________________________________ World Statistics Electricity Supplied (GWh) Total Net Electrical Capacity (MW) • Economics • Costs: • Costs of electricity are measured in • cents per kWh. • Capital costs – waste disposal an • decommissioning of plants • Fuel costs • Insurance costs • Operations and maintenance • Nuclear vs. Other Energy Sources: • Nuclear energy’s cost ranges from 104.40 to 115.30 in $/MWh • On average nuclear energy is the eighth cheapest energy source • Of the top eight, geothermal technology is the only source with a greater capacity factor than nuclear (92% vs. 90%) Nuclear Fact Sheet • Process: • Nuclear energy results from • the splitting of uranium atoms • in a process called fission. • Fission releases energy to make • steam to power a turbine that • generates electricity. • Types: • Boiling Water Reactor- • The same water loop serves as a moderator, coolant for the core, and steam source for the turbine. • Pressurized Water Reactor- • The water which flows through the reactor core is isolated from the turbine. • Liquid-Metal Fast-Breeder Reactor- • The fission reaction produces heat to run the turbine while at the same time breeding plutonium fuel for the reactor. Technology Matthew Pigott EGRS 352 Professor Nicodemus • Nuclear Energy & the Environment • Emissions: • Nuclear reactors produce neither air pollution nor carbon dioxide in operation. • Wastes: • Include uranium mill tailings, spent reactor fuel, and other radioactive wastes. • Spent radioactive fuel is initially stored in specially designed pools or dry concrete or steel storage containers until sufficient radioactive half-life decay levels are reached. • Land: • To produce approx. 1,800 MW of nuclear power with two reactors, 1,100 acres of land is needed. • Nuclear Energy & the Community • Safety: • U.S. Nuclear Regulatory Commission regulates the handling, transportation, storage, and disposal of nuclear wastes. • Large range surrounding nuclear power plants is restricted and guarded by armed security teams. • U.S. reactors have containment vessels designed to withstand extreme weather events and earthquakes. • Risk: • The NRC uses Probabilistic Risk Assessment to evaluate overall nuclear energy risk. • Risk is reduced by making an undesirable event less likely or by making its outcome less serious.
Nuclear Fact Sheet References • Matthew Pigott • EGRS 352 • Professor Nicodemus _______________________________________________________________ • General Information • Data retrieved from IAEA.org • “Nuclear Share of Electricity Generation in 2013” • http://www.iaea.org/PRIS/WorldStatistics/NuclearShareofElectricityGeneration.aspx • Graph 1 represents the nuclear share (%) by individual country • Graph 2 shows the percent by country of total electricity supplied by nuclear energy in GWh of the top 10 countries and the rest of the world • Graph 3 depicts the total net electrical capacity in MW of each country with a greater electrical capacity than 10,000 MW • Economics • Graph 1 retrieved from the World Nuclear Association’s image library • WNA studied varying energy sources’ costs from 1995 to 2012 in cents/kWh • http://world-nuclear.org/Gallery/?galleryId=4455%20&ImageId=36370 • Graph 2’s data was retrieved from the U.S. Energy Information Administration’s Annual Energy Outlook 2013, January 2013 • Technology • Images and descriptions retrieved from HyperPhysics at Georgia State University’s website • http://hyperphysics.phy-astr.gsu.edu/hbase/nucene/reactor.html • A major advantage of the pressurized water reactor over the boiling water reactor is the separate chamber from the turbine prevents any fuel leak from having radioactive contaminants from entering the turbine and condenser • Nuclear Energy & the Environment • Information collected from U.S. Energy Information Administration • “Nuclear Power & the Environment” • http://www.eia.gov/energyexplained/index.cfm?page=nuclear_environment • Nuclear Energy & the Community • Information attained from Entergy’s “A Comparison: Land Use by Energy Source – Nuclear, Wind and Solar” • Risk information retrieved from U.S. Nuclear Regulatory Commission • “Fact Sheet on Probabilistic Risk Assessment” • http://www.nrc.gov/reading-rm/doc-collections/fact-sheets/probabilistic-risk-asses.html