Download
1 / 22
230 likes | 484 Views
Waste Conversion Technologies Life Cycle Assessment. California Integrated Waste Management Board Board Meeting May 22, 2004 Keith Weitz, RTI International. What is Life Cycle Assessment?. “Cradle-to-grave" systems analysis Upstream and downstream Multi-media / Multi-pollutant

E N D
Waste Conversion Technologies Life Cycle Assessment California Integrated Waste Management Board Board Meeting May 22, 2004 Keith Weitz, RTI International
What is Life Cycle Assessment? • “Cradle-to-grave" systems analysis • Upstream and downstream • Multi-media / Multi-pollutant • ISO 14040 provides guidelines for conducting an LCA and LCA typically includes: • Inventory Analysis • Impact Assessment • Interpretation
Overall Approach • Defined conversion technologies based on existing systems for: • Acid hydrolysis (Masada) • Gasification (Brightstar Environmental) • Catalytic Cracking (Plastics Energy, LLC) • Developed material and energy balances • Developed life cycle inventory models • Analyzed alternative scenarios
Defined Conversion Technologies ProcessedWaste Gasifier/Reformer Cyclone GasScrubber Water Cooler/Treatment Centrifuge GasCooler Mix Tank De-Emulsifier Engine/Generator Set Waste HeatRecovery Air PollutionControl Gasification – Brightstar Environmental Technology
Material and Energy Balance Energy Materials Products Feedstock (Processed MSW) Conversion Technology Energy WaterPollution Air Emissions Solid Waste
Material and Energy Balance • Developed by the National Renewable Energy Laboratory using a commercial model called ASPEN Plus • Used publicly available information • Patent applications • Responses to UC questionnaire • Communicated with technology vendors • Employed conservative assumptions • Contaminate removal efficiency • Air pollution control
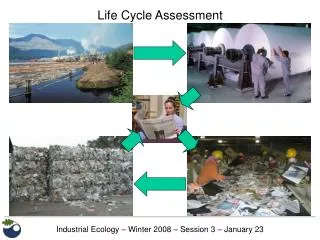
Life Cycle Inventory • Started with materials and energy balances • Used RTI’s solid waste model to capture remaining processes: • Collection • Transfer station • Materials separation/recycling • Composting • Combustion • Landfill • Data gaps filled with data from a commercial life cycle database – Ecobalance DEAM/TEAM: • Chemicals and fuels
Life Cycle Boundaries Energy and Materials Energy and Materials Energy and Materials Energy and Materials Material and Energy Balance Materials Separation Conversion Technology (e.g., acid hydrolysis) Land Disposal Collection Emissions Emissions Emissions Products(gypsum) Residues(filtercake) Energy Emissions
Scenarios Analyzed • Landfill • Gas vent (worst case) • Gas collection and flare (average case) • Gas collection and energy recovery (best case) • Waste-to-Energy • Composting • Recycling • 35 percent separation efficiency • 55 percent separation efficiency • 75 percent separation efficiency • Conversion technology
Conversion Technology Scenario 2003 (Base Year) • Three 500 dry tpd acid hydrolysis facilities (1,500 dry tpd total). • Four 500 dry tpd gasification facilities (2,000 dry tpd total). • One 50 dry tpd catalytic cracking facility (50 dry tpd total). Years 2004 to 2010 • One additional 500 dry tpd gasification plant 2005. • Two additional 500 dry tpd acid hydrolysis plants in 2007. • One additional 500 dry tpd gasification plant built in 2010.
Conversion Technology Scenario The total amount is the quantity of waste managed by all scenarios
Findings • Finding #1: The amount of energy produced by the conversion technology scenario is larger than the alternative management scenarios studied and creates large life cycle benefits.
2010 San Francisco Results: Net Energy (MBTU) 4,000,000 0 -4,000,000 -8,000,000 -12,000,000 -16,000,000 -20,000,000 Recycling55% Efficiency ConversionTechnology WTE Recycling-75% Efficiency Landfill-EnergyRecovery Compost Landfill-Flare Landfill-Vent Recycling35% Efficiency
Findings • Finding #2: For criteria air pollutants, the conversion technology scenario is better than the alternative management scenarios.
2010 San Francisco Results: Net NOx Emissions (lb) 3,000,000 2,000,000 1,000,000 0 -1,000,000 -2,000,000 -3,000,000 Recycling55% Efficiency ConversionTechnology WTE Recycling-75% Efficiency Landfill-EnergyRecovery Compost Recycling35% Efficiency Landfill-Vent Landfill-Flare
2010 San Francisco Results: Net SOx Emissions (lb) 1,000,000 0 -1,000,000 -2,000,000 -3,000,000 -4,000,000 -5,000,000 -6,000,000 Recycling35% Efficiency Recycling55% Efficiency ConversionTechnology WTE Recycling-75% Efficiency Landfill-EnergyRecovery Compost Landfill-Vent Landfill-Flare
Findings • Finding #3: From a climate change perspective, the conversion technology scenario is generally better than the alternative management scenarios.
2010 San Francisco Results: Net Carbon Emissions (MTCE) 6,000,000 5,000,000 4,000,000 3,000,000 2,000,000 1,000,000 0 -1,000,000 Recycling35% Efficiency Recycling55% Efficiency ConversionTechnology WTE Recycling-75% Efficiency Landfill-EnergyRecovery Compost Landfill-Vent Landfill-Flare
Findings • Finding #4: Insufficient data were available to assess the potential for the conversion technology scenario to produce emissions of dioxins, furans, and other HAPs. • Finding #5: The environmental benefits of the conversion technology scenario are highly dependent upon their ability to achieve high conversion efficiencies and materials recycling rates. • Finding #6: Conversion technologies would decrease the amount of waste disposed of in landfills. • Finding #7: No conversion technology facilities exist in the United States for MSW; therefore, there is a higher level of uncertainty regarding their environmental performance than existing waste management practices.
Uncertainties and Limitations • Conversion technologies studied don’t exist in the U.S. for MSW • Didn’t focus on optimal siting/co-location aspects • Uncertainty in how the feedstock will be delivered to the conversion facilities • Considered MSW only, no other types of waste • National averages used for most processes. • LCA is not a risk assessment. • No spatial differentiation • Net total emissions, not concentrations or rates of release
Future Research Needs • Update results with data from actual facilities in California and the U.S. • Analyze regions with a wider variation in waste composition. • Analyze other feasible conversion technologies. • Analyze optimal conversion technology facility configurations. • Analyze small modular conversion technology facilities.