Download
1 / 31
310 likes | 482 Views
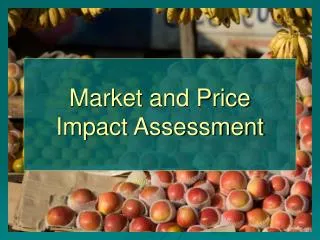
CONVERSION TECHNOLOGIES MARKET IMPACT ASSESSMENT. Preliminary Results Workshop April 15, 2004 Susan V. Collins Hilton Farnkopf & Hobson, LLC. Study Objectives Overall Approach Assumptions Analysis & Model Development Preliminary Results and Key Findings. PRESENTATION OUTLINE.

E N D
CONVERSION TECHNOLOGIES MARKET IMPACT ASSESSMENT Preliminary Results Workshop April 15, 2004 Susan V. CollinsHilton Farnkopf & Hobson, LLC
Study Objectives Overall Approach Assumptions Analysis & Model Development Preliminary Results and Key Findings PRESENTATION OUTLINE
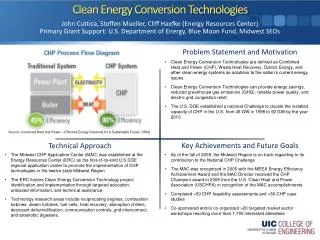
The CIWMB’s report on conversion technologies shall contain “a description and evaluation of the impacts on the recycling and composting markets as a result of each conversion technology.” BACKGROUND - AB 2770
Effects on recycling and composting industries due to increases or decreases in feedstock supply If a tonnage effect, estimate economic gains or losses If a price effect, estimate economic gains or losses STUDY OBJECTIVES: Economic and Financial
Effects on hauler contractual relationships Effects on municipal contractual relationships Effects on regional recycling & composting infrastructure Effects of put-or-pay contracts on recycling & composting businesses STUDY OBJECTIVES: Institutional
GENERAL ASSUMPTIONS: Assumed Annual Capacities (tons per year)
Develop CT configuration assumptions & other key modeling assumptions Develop baseline projections for recycling and composting Estimate impacts of CT on recycling and composting A financial model was developed to perform calculations OVERALL APPROACH
Waste composition Quantities of paper, plastics and organics recycled (in-state and exports); Pricing of recyclables, organics and landfill fees New diversion program plans MRF and landfill throughput and capacity CT feedstock needs Jurisdictional contracting arrangements Jobs and revenues per ton for targeted industries APPROACH: Data Gathering
Facility Proponent Requirements (surveys & interviews) Jurisdictional Requirements (interviews, document review) Composition of Waste Stream (CIWMB, assumptions, SB 1066, calculations) Pricing (surveys, interviews, contract review) FEEDSTOCK METHODOLOGY
Won’t receive C&D and HHW for processing (16% of waste stream in Los Angeles area; 19% in SF) Removes glass and metals for recycling and some disposal (10% of incoming waste in LA; 11% in SF) Retains paper, plastic, organics, and mixed residue (74% of incoming waste in LA; 69% in SF) GASIFICATION FEEDSTOCK REQUIREMENTS
Won’t receive C&D and HHW for processing (16% of waste disposed in Los Angeles area; 19% in SF) Removes glass, plastics and metals for recycling (10% of incoming waste in LA; 10% in SF) some for disposal (10% in LA & SF) Retains paper, organics and mixed residue (65% of waste disposed in LA; 61% in SF) ACID HYDROLYSIS FEEDSTOCK REQUIREMENTS
Receives only plastic bags from MRFs Plastic film is 3.6% (in SF) to 4.4% (in LA) of the disposal waste stream CATALYTIC CRACKING FEEDSTOCK REQUIREMENTS
No operating facilities in US currently; two in development in 2004 (CA & NY) Development costs of $40 to 70 million Tipping fees of $25 to $65 per ton Specific feedstock requirements with put-or-pay provisions highly likely CT PRICING & HISTORY
National paper recovery rates (total collected) grew 40% in the 10-year period of 1992-2002, but only 8% in the 5-year period of 1997-2002 OCC: 74% recovery rate nationally; News: 71% recovered nationally CA has greater recycling infrastructure than US average Tremendous price volatility; yearly high prices are commonly double that of yearly low prices Nationally, paper generation (consumption) is falling slightly PAPER BACKGROUND: IN-COUNTRY
Paper exports from LA & SF go to 64 countries Four-year growth rates of 58% (LA), 68% (SF) ALL of the growth in paper exports went to China PAPER BACKGROUND - EXPORTS
Paper prices range from $7.50 to $105 per ton on average; the lowest grade (mixed office) ranged from -$10 per ton to $20 per ton in 2002 Annual average prices for exports per ton went from $84 (‘98) to $99 (‘00) to $84 (‘02) Prices have been positive since 1996/97 PAPER BACKGROUND - PRICE HISTORY
Paper is an acceptable feedstock for two technologies: acid hydrolysis and gasification Assuming CT pricing is similar to landfilling, CT will not change current economic incentives to recycle paper Exception: if the lowest grade dropped in price to levels too low for cost-efficient recovery, it could be added to MRF residuals for subsequent CT processing. However, CT facilities need consistent quantity and quality of feedstock, so possibilities for rapid switching of feedstock may be limited. PAPER OUTLOOK UNDER CT SCENARIO
Nationally, plastics generation is growing, but recycling levels are flat (recycling rate is falling) In CA, bottle bill plastics recovery has grown 68% from 2000 to 2003 (using tons collected) Plastic prices are $16 to $40 per ton on average for PET and HDPE flake; the other grades range from $10 per ton to no value at all 2002 Price volatility Nationally, 22% of recycled plastic resins are exported PLASTICS BACKGROUND: IN-COUNTRY & EXPORTS
Acid Hydrolysis cannot process plastics into product; Gasification can Catalytic Cracking uses only plastics, and uses the washing process to remove PVC The primary feedstock for Catalytic Cracking will be plastic bags, which currently have no recycling market. They could, however, be added to curbside recycling programs for this process PLASTICS OUTLOOK UNDER CT SCENARIO
CT prices are competitive with landfill prices, which require no sorting or separate collection Paper and plastics markets currently have positive prices WHY WOULDN’T PAPER, PLASTICS AND ORGANICS MOVE TO CT?
CIWMB studies for 2001 & 2003 produced reliable data for each region Organics generation (tonnage) is stable Very stable prices Prices are slightly lower than landfill prices; economic incentive to recycle is lower than for paper and some plastics Contract prices are sometimes significantly lower than gate rates ORGANICS BACKGROUND
Green waste is an acceptable feedstock for two technologies: acid hydrolysis and gasification Catalytic cracking can not accept green waste Biosolids (sludge) will be used at Masada’s plant Green waste tipping fees range from $11 per ton to disposal costs (at $40 per ton); prices are very stable over time ORGANICS OUTLOOK UNDER CT SCENARIO, 1
Assuming no diversion credit is given for CT, it is unlikely that green waste will be re-directed to CT facilities Jurisdictions will continue to require composting or ADC for diversion credit Economic incentive for self-haulers to deliver to lowest-cost facility Sufficient refuse tonnage exists at higher prices for CT to use refuse as feedstock ORGANICS OUTLOOK UNDER CT SCENARIO, 2
Organics may be re-directed to CT: If separate collection is changed to co-collection with refuse for cost savings If tipping fees are similar to landfills, but CT facility is closer (cost savings) If CT offers reduced rates for organics ORGANICS OUTLOOK UNDER CT SCENARIO, 3
Sufficient MRF capacity for residuals to supply half of CT demand in San Francisco Bay area Sufficient capacity for residuals in Greater Los Angeles region to supply all of CT demand; but ACTUAL throughputs are unknown MRF residuals may not be suitable feedstock for CT Materials desirable to CTs are removed by MRFs Materials undesirable to CTs are not typically removed by MRFs Co-location may provide favorable economics (transportation cost savings) MRF RESIDUAL ASSUMPTIONS
Scenarios assumed in this study: Net positive impact on recycling due to removal of glass, metal, and some plastics No re-direction of materials away from current recycling and composting markets because of price differentials (CT is higher cost) NET INCREASE IN RECYCLING DUE TO CT SORTING
Additional MRF sorting positions Additional recovered material CT facility jobs Landfill job losses JOB CREATION/DESTRUCTION UNDER CT SCENARIO
Municipal Contract haulers (single or multiple) Open Competition and Self-haul Combination is common (one arrangement for residential, another for non-residential) CURRENT INSTITUTIONAL ARRANGEMENTS
Municipalities can change arrangements if political will and contract flexibility Contract haulers can use CT, but need authority to do so for some contracted hauling Open Competition and self-haul have most flexibility, but least volume, and least ability to guarantee volumes to a CT operator HOW CT COULD CHANGE INSTITUTIONAL ARRANGEMENTS
No facilities operating in U.S.; some assumptions based on operating information from facility proponents or independent estimates Market conditions can change quickly; results are very sensitive to market condition assumptions Assumed current diversion activities would continue Number of jobs, revenues per 1,000 tons SENSITIVITIES