Download
1 / 32
320 likes | 397 Views
Factors Shaping Long-Term Future Global Energy Demand and Carbon Emissions. 7 th International Carbon Dioxide Conference September 25-30, 2005 Jae Edmonds, Hugh Pitcher, and Steve Smith 25 September 2005 Joint Global Change Research Institute Bloomfield, CO. Thanks to.

E N D
Factors Shaping Long-Term Future Global Energy Demand and Carbon Emissions 7th International Carbon Dioxide Conference September 25-30, 2005 Jae Edmonds, Hugh Pitcher, and Steve Smith 25 September 2005 Joint Global Change Research Institute Bloomfield, CO
Thanks to Peter Tans & the Organizers of the 7th International Carbon Dioxide Conference US DOE Office of Science EPRI Other sponsors of the GTSP Nebojsa Nakicenovic, Brian Fisher, Richard Richels, & John Weyant 2
Key Question for Today • What are the sources of CO2 emissions? • How much carbon is there? • What are the fundamental drivers of CO2 emissions? • What range of CO2 emissions trajectories could be anticipated (reference and stabilization)? 3
Final Thoughts • Reference case fossil fuel and land-use change carbon emissions are dominated by the fossil fuel loading. • There is significant uncertainty in CO2 loading of the atmosphere and oceans. • FF emissions range in 2100 from • ~3 PgC/y (SRES B1T MESSAGE) to • >35 PgC/y (SRES A1C AIM) • Cumulative emissions 1990 to 2100 range from • <775 Pg to (SRES B1T MESSAGE) • >2,500 Pg (SRES A1C AIM) • The high end of these ranges are truncated in stabilization scenarios. • Dramatic changes in energy technology are needed over the century to realize the lower end of the range. 4
Sources of Anthropogenic CO2 Emissions • Fossil fuel use (7.0 PgC/y in 2002) • Natural gas 13.7 TgC/EJ • Oil 20.2 TgC/EJ • Coal 25.5 TgC/EJ • Industrial process emissions (e.g. cement) • 0.2 PgC/y • Land-use change emissions (1.7; 0.6-2.6 PgC/y) • Deforestation • Soil cultivation 5
Fossil Fuel Carbon Emissions2002 Source: Carbon Dioxide Information Analysis Center, Oak Ridge National Laboratory. 6
Land-use Carbon Emissions1999 Range of Land-use Emissions Source: Carbon Dioxide Information Analysis Center, Oak Ridge National Laboratory, based on Houghton. Source: IPCC WG1 Third Assessment Report. 7
Global Primary Energy Source: IIASA 8
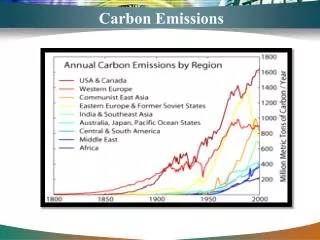
Historical Fossil Fuel CO2 Emissions 1751 to 2002 Source: Carbon Dioxide Information Analysis Center. 9
Land-use Emissions 1850 to 2000 Source: Carbon Dioxide Information Analysis Center, Oak Ridge National Laboratory, based on Houghton. 10
ENERGY RESOURCESWill the Problem Go Away on Its Own? Won’t the limited conventional oil and gas resource force a transition in the near term to a world based on energy efficiency and renewable and nuclear energy forms? 11
Carbon Reservoirs Atmosphere 800 PgC (2004) Biomass ~500 PgC N. Gas ~260 PgC Oil ~270 PgC Soils ~1,500 PgC Coal 5,000 to 8,000 PgC Unconventional Fossil Fuels 15,000 to 40,000 PgC 12
Scenarios of Future Emissions Scenarios of future anthropogenic carbon emissions to the atmosphere use complex energy-economy-land-use models. 13
Future Carbon Emissions Scenarios • Which of the literally thousands of parameters are most important to determining future emissions of greenhouse gases? • Uncertainty analysis conducted to explore precisely this question. • Edmonds, Reilly, Gardner and Brenkert (1986) • Scott, Sands, Edmonds, Liebetrau and Engel (2000) • Others include Nordhaus and Yohe (1983), Hammitt (1992), Manne and Richels (1993), Alcamo, et al. (1994), Dowlatabadi (1999), Gritsevskyi and Nakicenovic (1999) 14
Results From an Uncertainty Analysis Technology is the broad set of processes covering know-how, experience and equipment, used by humans to produce services and transform resources. (Not just devices) 15
Demographics • Future global population is relatively certain in the near term, • But uncertain in the long term. • Forecasts of population growth have risen, peaked and declined over the past 25 years. • The present best guess population is about where it was in 1978. • Future populations are aging rapidly. 16
Population Trajectories Are Falling • Population estimates have declined recently • Many scenarios show global populations declining at the end of the 21st century. Lutz et al., 1997, 2001 17
Increased Life ExpectancyExacerbates Aging and Increases Population Both use TCF=1.9 18
Labor Productivity • GDP = Labor productivity * Labor(hours) • Labor productivity growth rates are the major determinant of the scale of economic activity. • They are relatively stable in the developed world. • They are highly varied in the developing world. • Uncertainty in developing country labor productivity growth is a major source of uncertainty in carbon emissions. 19
Stabilizing CO2Base Case and “Gap” Technologies • Assumed advances in familiar technologies • Fossil fuels • End use energy • Nuclear • Renewables • Less familiar technologies • Carbon capture & disposal • Adv. fossil • H2 and adv. transportation • Biotechnologies • Soils, Bioenergy, adv. Biological energy The “Gap” 21
Range of Reference Case Fossil Fuel Carbon Emissions Source: IIASA Median SRES 2100 emission = 14.4 PgC/y Open literature 2100 emissions ~20 PgC/y 22
Range 765 to 2,531 PgC Median 1,500 PgC 23
Technology Alone Won’t NECESSARILY Stabilize CO2 Concentrations Energy Related Carbon Emissions A reference case with continued technology development, and no climate policy. A reference case with advanced technology development of carbon capture and H2, but no climate policy. Emissions path that stabilizes CO2 concentrations at 550 ppm. 26
Policy Alone Will Not Necessarily Deliver the Environmental Benefit at Lowest Cost • Hypothetical carbon tax, uniformly & efficiently applied over to everyone, everywhere • Advanced fossil fuel technologies cut cost by more than half 27
Land Use Emissions Land-use change emissions depend on • Population • Income • Technology • Climate (including water) • Policy (including climate policy) • Land use emissions are uncertain, but • Generally lower than fossil fuel emissions. 28
IPCC SRES Reference Case Land-Use Change Emissions Scenarios 29
Temperature stabilization scenario MiniCAM B2 Reference scenario Land-Use Emissions are Sensitive to Agricultural Productivity Growth Rates and to Energy Policy 30
CO2 Concentrations Pre-industrial CO2 = 280 ppm 1958 Mauna Loa CO2 = 315 ppm 2004 Mauna Loa CO2 = 377 ppm 31
Final Thoughts • Reference case fossil fuel and land-use change carbon emissions are dominated by the fossil fuel loading. • There is significant uncertainty in CO2 loading of the atmosphere and oceans. • FF emissions range in 2100 from • ~3 PgC/y (SRES B1T MESSAGE) to • >35 PgC/y (SRES A1C AIM) • Cumulative emissions 1990 to 2100 range from • <775 Pg to (SRES B1T MESSAGE) • >2,500 Pg (SRES A1C AIM) • The high end of these ranges are truncated in stabilization scenarios. • Dramatic changes in energy technology are needed over the century to realize the lower end of the range. 32