ROC Curve Analysis of Prognostic Scores in Athens and Vienna Stroke Cohorts
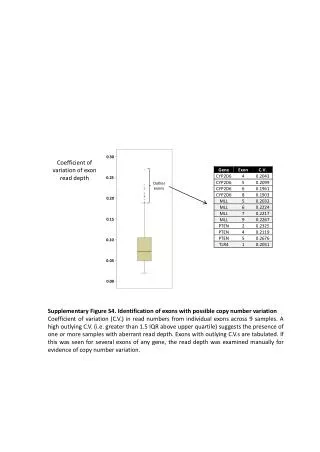
This study analyzes the Receiver Operating Characteristic (ROC) curves of prognostic scores derived from the Athens and Vienna cohorts. The sensitivity and specificity metrics reveal insights into the performance of the prognostic score in both cohorts, with areas under the ROC curve (AUC) recorded at 0.8502 for Athens and 0.7715 for Vienna. The combined analysis shows improved predictive accuracy, indicating the strength of the prognostic score across different populations. The results demonstrate the relevance of these scores in clinical decision-making.

ROC Curve Analysis of Prognostic Scores in Athens and Vienna Stroke Cohorts
E N D
Presentation Transcript
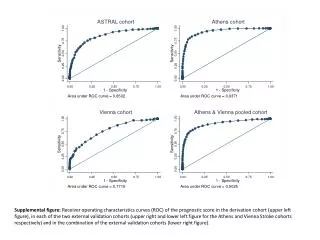
ASTRAL cohort Athens cohort 1.00 1.00 0.75 0.75 0.50 0.50 Sensitivity Sensitivity 0.25 0.25 0.00 0.00 0.00 0.25 0.50 0.75 1.00 0.00 0.25 0.50 0.75 1.00 1 - Specificity 1 - Specificity Area under ROC curve = 0.8502 Area under ROC curve = 0.9371 Vienna cohort Athens & Vienna pooled cohort 1.00 1.00 0.75 0.75 0.50 0.50 Sensitivity Sensitivity 0.25 0.25 0.00 0.00 0.00 0.25 0.50 0.75 1.00 0.00 0.25 0.50 0.75 1.00 1 - Specificity 1 - Specificity Area under ROC curve = 0.7715 Area under ROC curve = 0.9025 Supplemental figure: Receiver operating characteristics curves (ROC) of the prognostic score in the derivation cohort (upper left figure), in each of the two external validation cohorts (upper right and lower left figure for the Athens and Vienna Stroke cohorts respectively) and in the combination of the external validation cohorts (lower right figure).