0.00
ASTRAL cohort. Athens cohort. 1.00. 1.00. 0.75. 0.75. 0.50. 0.50. Sensitivity. Sensitivity. 0.25. 0.25. 0.00. 0.00. 0.00. 0.25. 0.50. 0.75. 1.00. 0.00. 0.25. 0.50. 0.75. 1.00. 1 - Specificity. 1 - Specificity. Area under ROC curve = 0.8502. Area under ROC curve = 0.9371.

0.00
E N D
Presentation Transcript
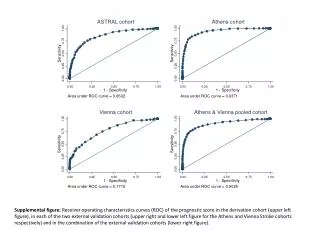
ASTRAL cohort Athens cohort 1.00 1.00 0.75 0.75 0.50 0.50 Sensitivity Sensitivity 0.25 0.25 0.00 0.00 0.00 0.25 0.50 0.75 1.00 0.00 0.25 0.50 0.75 1.00 1 - Specificity 1 - Specificity Area under ROC curve = 0.8502 Area under ROC curve = 0.9371 Vienna cohort Athens & Vienna pooled cohort 1.00 1.00 0.75 0.75 0.50 0.50 Sensitivity Sensitivity 0.25 0.25 0.00 0.00 0.00 0.25 0.50 0.75 1.00 0.00 0.25 0.50 0.75 1.00 1 - Specificity 1 - Specificity Area under ROC curve = 0.7715 Area under ROC curve = 0.9025 Supplemental figure: Receiver operating characteristics curves (ROC) of the prognostic score in the derivation cohort (upper left figure), in each of the two external validation cohorts (upper right and lower left figure for the Athens and Vienna Stroke cohorts respectively) and in the combination of the external validation cohorts (lower right figure).