Download
1 / 1
10 likes | 108 Views
Anomalous formaldehyde 6-cm CMB absorption in the L1204/S140 region Mónica I. Rodríguez 1 , Laurent Loinard 1 , Ron J. Allen 2 and Tommy Wiklind

E N D
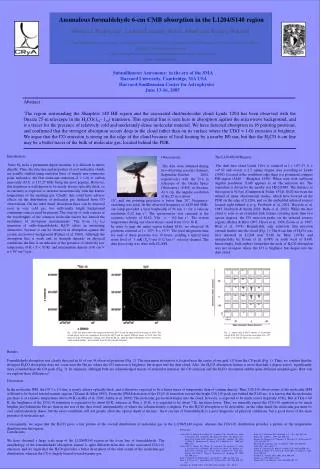
Anomalous formaldehyde 6-cm CMB absorption in the L1204/S140 region Mónica I. Rodríguez1, Laurent Loinard1, Ron J. Allen2 and Tommy Wiklind 1: Centro de Radiostronomía y Astrofísica, Universidad Nacional Autónoma de México, Apartado Postal 72--3 (Xangari), 58089 Morelia, Michoacán, México m.rodriguez, l.loinard@astrosmo.unam.mx 2: Space Telescope Science Institute, 3700 San Martin Drive, Baltimore, MD 21218 US rjallen, wiklind@stsci.edu Submillimeter Astronomy: in the era of the SMA Harvard University, Cambridge, MA USA Harvard-Smithsonian Center for Astrophysics June 13-16, 2005 Abstract : The region surrounding the Sharpless 140 HII region and the associated dust/molecular cloud Lynds 1204 has been observed with the Onsala 25-m telescope in the H2CO(111- 110) transition. This spectral line is seen here in absorption against the microwave background, and is a tracer for the presence of relatively cold and moderately dense molecular material. We have detected absorption in 16 pointing positions, and confirmed that the strongest absorption occurs deep in the cloud rather than on its surface where the CO(J = 1-0) emission is brightest. We argue that the CO emission is strong on the edge of the cloud because of local heating by a nearby B0 star, but that the H2CO 6-cm line may be a better tracer of the bulk of molecular gas, located behind the PDR. Introduction : Since H2 lacks a permanent dipole moment, it is difficult to detect directly. Thus, the structure and properties of cool molecular clouds are usually studied using emission lines of simple non-symmetric polar molecules, the first rotational transition (J = 1-0) of carbon monoxide (CO), at 115.27 GHz being the most popular. However, this transition is well-known to be nearly always optically thick, so its intensity is expected to increase monotonically with the kinetic temperature of the emitting gas. Clearly, this could have adverse effects on the distribution of molecular gas deduced from CO observations. On the other hand, absorption lines can be detected even in very cold gas, but sufficiently bright background continuum sources need be present. The scarcity of such sources at the wavelenghts of the common molecular tracers has limited the usefulness of absorption measurements. The 6-cm (111-110) transition of ortho-formaldehyde H2CO offers an interesting alternative, because it can be observed in absorption against the cosmic microwave background (Palmer et al. 1969). Although the absorption line is weak and its strength depends on physical conditions, the line is an indicator of the presence of relatively low temperature (8 K < T < 30 K) and intermediate density (100 cm-3< n < 105 cm-3) gas. The L1204/S140 Region : The dark dust cloud Lynds 1204, is centered at l = 107o.47, b = +4o.82 and covers a 2.5 square degree area according to Lynds (1962). Located at the southwest edge there is a prominent compact HII region (S140 − Sharpless 1959). When seen with sufficient angular resolution, S140 appears as an Hα emission arc. The ionization is driven by the nearby star HD211880. The distance to the region is 910 pc (Crampton & Fisher 1974). S140 has been the subject of many observational studies, which have focused on the PDR on the edge of L1204, and on the embedded infrared sources located right behind it (e.g. Preibisch et al. 2001; Hayashi et al. 1987; Preibisch & Smith 2002; Bally et al. 2002). While the dust cloud is seen as an extended dark feature covering more than two square degrees, the CO emission peaks on the infrared sources regions (Helfer & Blitz 1997, Heyer et al. 1996, Evans et al. 1987, Blair et al. 1978). Remarkably, only relatively dim emission extends further into the cloud (Fig. 1). The 6-cm line of H2CO was first detected in L1204 near S140 by Blair (1978), and unexpectedly by Evans et al. (1987) in north west of S140. Interestingly, both authors found that the peak of H2CO absorption was not strongest where the CO is brightest, but deeper into the dust cloud. Observations : The data were obtained during two observing sessions (January, September-October 2004, respectively) with the 25.6 m telescope of the Onsala Space Observatory (OSO) in Sweden. At 6 cm, the angular resolution of the 25 m is about ___ 10’, and our pointing precision is better than 20”. Frequency- switching was used. At the observed frequency of 4829.660 MHz, our setup provided a total bandwidth of 96 km s-1 for a velocity resolution 0.12 km s-1. The spectrometer was centered at the systemic velocity of S140, Vlsr = − 8.0 km s-1. The system temperature during our observations varied from 33 to 36 K. In order to map the entire region behind S140, we observed 36 positions centered at l = 107o, b = +5.3o. The total integration time for each of these positions was 10 hours, yielding a typical final noise level of 3 mK (TA*) per 0.12 km s-1 velocity channel. The data processing was done with CLASS. Fig. 2.- Square grid of H2CO spectra at 36 positions toward S140. The (0,0) position correspond to l = 107o and b = +5.3o and the offsets are in l and b. Fig. 1.-The first panel shows the comparison between the CO and the optical DSS-red image of S140. The second panel shows the comparison between the H2CO and the optical DSS-red image of S140. Note the decrease of the CO brightness moving away from the Hα arc, while the H2CO absorption covers a big region which extends further, and resembles more the dust absorption feature. Results : Formaldehyde absorption was clearly detected in 16 of our 36 observed positions (Fig. 2). The maximum absorption is located near the center of our grid, 10' from the CO peak (Fig. 1). Thus, we confirm that the strongest H2CO absorption does not occur near the Hα arc where the CO emission is brightest, but deeper into the dust cloud. Also, the H2CO absorption feature is more than half a degree across, significantly more extended than the CO peak (Fig. 1). In summary, although both are acknowledged tracers of molecular material, the CO emission and the H2CO absorption exhibit quite different morphologies. How can we explain these differences? Discussion : In the molecular ISM, the CO J = 1-0 line is nearly always optically thick, and is therefore expected to be a better tracer of temperature than of column density. Thus, CO(1-0) observations of the molecular ISM will tend to be biased toward warmer regions (Tilanus & Allen 1993). From the SWAS detection of the CO(5-4) transition toward the bright CO(1-0) peak just behind the S140 arc, it is known that the molecular gas there is at a kinetic temperature above 60 K (Ashby et al. 2000, Ashby et al. 2000). The molecular gas located deeper into the cloud, however, is expected to be much cooler (typically 10 K). But at Tkin = 60 K, the brightness of the CO(1-0) transition is expected to be about 60 K, whereas at Tkin = 10 K, it is expected to be about 7 K, ten times lower. Thus, we naturally expect the CO(1-0) emission to be much brighter just behind the Hα arc than in the rest of the dust cloud, independently of where the column density is highest. For the H2CO absorption to be detectable, on the other hand, the molecular gas must be cool and moderately dense, but the exact conditions will not greatly affect the optical depth of the line : the 6 cm line of formaldehyde is a poor diagnostic of physical conditions, but a good tracer of the mere presence of molecular gas. Consequently, we argue that the H2CO gives a fair picture of the overall distribution of molecular gas in the L1204/S140 region, whereas the CO(1-0) distribution provides a picture of the temperature distribution in the region. Bibliography: Ashby, M.L.N., Bergin, E.A., Plume, R., Carpenter, J.M., Neufeld, D.A., Chin, G., Erickson, N.R., Goldsmith, P.F., Harwit, M., Howe, J.E., Kleiner, S.C., Koch, D.G., Patten, B.M., Schieder, R., Snell, R.L., Stauffer, J.R., Tolls, V., Wang, Z., Winnewisser, G., Zhang, Y.F., & Melnick, G.J., 2000, ApJ, 539, L115 Ashby, M.L.N., Bergin, E.A., Plume, R., Carpenter, J.M., Melnick, G.J., Chin, G., Erickson, N.R., Goldsmith, P.F., Harwit, M., Howe, J.E., Kleiner, S.C., Koch, D.G., Neufeld, D.A., Patten, B.M., Schieder, R., Snell, R.L., Stauffer, J.R., Tolls, V., Wang, Z., Winnewisser, G., & Zhang, Y.F., 2000, ApJ, 539, L119 Bally, J., Reipurth, B., Walawender, J., & Armond, T., 2002, AJ, 124, 2152 Blair, G.N., Evans, N.J., Vanden Bout, P.A., & Peters W.L., 1978, ApJ, 219, 893-913 Crampton, D., & Fisher, W.A., 1974, Pub. Dom. Astrophys. Obs., 14, 283 Conclusions : We have obtained a large scale map of the L1204/S140 region in the 6-cm line of formaldehyde. The morphology of the formaldehyde absorption feature is quite different from that of the associated CO(1-0) emission, and we argue that the H2CO provides a better description of the total extent of the molecular gas distribution, whereas the CO is largely biased toward warmer gas. Evans, N..J., II, Kutner, M.L., & Mundy, L.G., 1987, ApJ, 323, 145 Helfer, T.T., & Blitz, L., 1997, ApJ, 478, 233 Hayashi, M., Hasegawa, T., Omodaka, T., Hayashi, S.S., & Miyawaki, R., 1987, ApJ, 312, 327 Heyer, M..H., Carpenter, J..M., & Ladd, E.F., 1996, ApJ, 463, 630 Lynds, B.T., 1962, ApJS, 7, 1 Palmer, P. Zuckerman, B. Buhl, D. & Snyder, L.E. 1969 ApJ 156, 147 Preibisch, T., Balega, Y.Y., Schertl, D., Smith, M.D., & Weigelt, G., 2001, A&A, 378, 539 Preibisch, T., & Smith, M.D, 2002, A&A, 383, 540 Sharpless, S. 1959, ApJS, 4, 257 Tilanus, R.P., J. & Allen, R.J., 1993, A&A 274, 707-729