Direct Measurement of EEX: Matrix Elements & Bunch Length Analysis
In this study, preliminary EEX transfer matrix data and dispersion data along a line are analyzed. Direct measurements of EEX bunch length show resolution limits of less than 3pSec. A calibration method corrects observed signals for accurate bunch length derivation. Further efforts include refining output analysis and completing matrix element measurements. This is work in progress towards graduation goals.

Direct Measurement of EEX: Matrix Elements & Bunch Length Analysis
E N D
Presentation Transcript
EEX Update June 18 2008 Tim Koeth
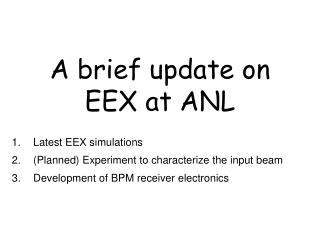
Data that we have • Preliminary EEX transfer matrix • (10/16 good) • Dispersion data along line - TBA • Prelimary ex ez direct measurement • Prelimary eZ eX raw data - TBA
Matrix 2 = redo
Bunch Length Measurements 5 cell off: 5pSec 5 cell on: </=3pSec ! Resolution limit of entire setup Thank you Jinhao & Alex ! Did not see a drastic reduction in momentum spread.
Additional Broaden caused by limiting resolution caused by slit width Intensity Group velocity dispersion Time(ps) Very short OTR signal from e-bunch Broadened OTR signal from e-bunch Shown on the streak camera screen Just before the streak camera Immediate after the OTR screen
Assume a real bunch length first (red line) • Modeled the observed OTR bunch length by streak camera by adding the influence of group velocity dispersion and limiting resolution due to slit width (Blue circles) • Use sum of the terms in quadrature to correct the observed signal and derive the real bunch length (blue dot)
This is the calibration done for Range 1 (0.32ps/channel) with 550 nm LP filter
OUTPUT HORIZONTAL EMITTANCE A work in progress X23 SPOT TM110 OFF X23 SPOT TM110 ON
Tim’s to do list for graduation • Finish the Matrix Elements Measurements • X3 (HTBX03) BPM 28 Transfer matrix • Dispersion measurement throughout entire line • Attempt at a direct EEX measurement • Complete EEX horizontal output analysis • Refine bunch length measurement ?