Download
1 / 10
100 likes | 202 Views
Supplementary Figure 1A. List of miRNAs enriched independent of IR. Surviving Fraction. Supplementary Figure 1B. Clonogenic survival assay was performed with 2 Gy IR in 12 different GBM lines. Bar graphs were generated with Mean ± S.D. of 3 independent experiments. 1.2. 1.0. 0.8. 0.6.

E N D
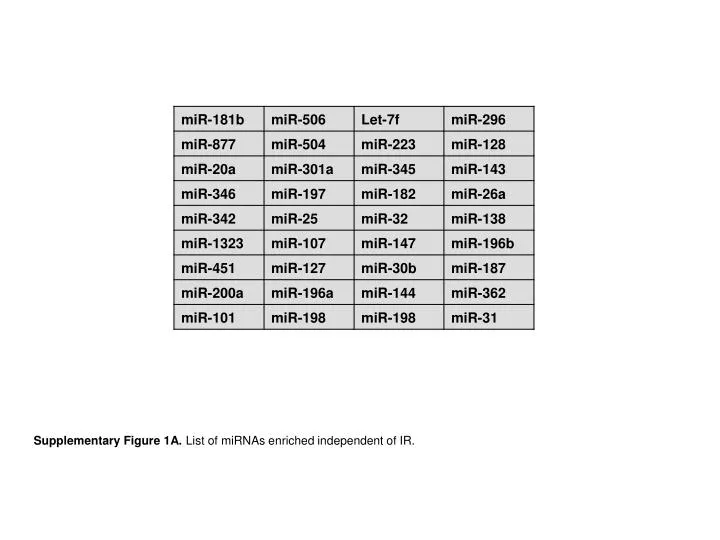
Supplementary Figure 1A. List of miRNAs enriched independent of IR.
Surviving Fraction Supplementary Figure 1B. Clonogenic survival assay was performed with 2 Gy IR in 12 different GBM lines. Bar graphs were generated with Mean ± S.D. of 3 independent experiments.
1.2 1.0 0.8 0.6 Surviving Fraction 0.4 0.2 miRs in LN229 0.0 0 1 3 5 Ionizing Radiation (Gy) Supplementary Figure 2A. IR sensitivity of LN229 with individual stable expression of miR-1, miR-125a, miR-150 and miR-425 was determined by clonogenic assay. Curves were generated with Mean ± S.D. of 3 independent experiments. For statistical analysis the areasunder the curves were calculated by approximating them to trapezoids. Comparison was done with one-way ANOVA (p < 0.05) and Tukey’s post hoc (p < 0.05) test. Ionizing Radiation (Gy)
50 40 30 Relative miRNA expression 20 10 0.0 miR-1 miR-125a miR-150 miR-425 Supplementary Figure 2B. Expression of fused miR-1, miR-125a, miR-150 and miR-425 from pcDNA3.1 vector.
A B 1.2 1.0 0.8 0.6 Relative GFP expression Sp-Control 0.4 Sp-425 0.2 Sp-125a Sp-1 Sp-150 0.0 All 4 miRNAs miR-1 miR-125a miR-150 miR-425 * * * * Supplementary Figure 3. (A) Illustration shows the construct of GFP-fused miRNA sponges. GFP is fused at the 3’ end of 4 identical repeats of miRNA sponges in tandem. The sequence of each miRNA sponge is shown below. (B) Inhibition of GFP expression fused to miRNA sponges was tested by transfecting corresponding miRNA mimics. Comparison was done with one-way ANOVA (p < 0.05) and Tukey’s post hoc (p < 0.05) test.
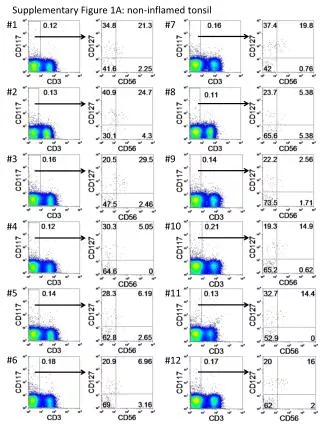
12 10 * * * * 8 * 6 Relative Caspase 3/7 Activity 4 2 0 miR-scr miR-1 miR-125a miR-150 miR-425 miR-4x‘ Supplementary Figure 4A. Impact of individual miR-scr, miR-1, miR-125a, miR-150 and miR-425 and combined miR-4x’ on apoptosis in LN229 cells. Cells were exposed to 10 Gy γ-IR and the activation of Caspase 3 and 7 was determined with Caspase-Glo 3/7 Assay System. Comparison was done with one-way ANOVA (p < 0.05) and Tukey’s post hoc (p < 0.05) test.
miR-scr miR-1 miR-125a miR-150 miR-425 0 1 6 0 1 6 0 1 6 0 1 6 0 1 6 hours p-chk1 (S345) chk1 * * * * * * * * Supplementary Figure 4B. Phosphorylation of Chk1 S345 in LN229 cells transfected with indicated miRNA upon exposure to 10 Gy IR. The mean ± S.D. of 3 independent experiments is demonstrated. Comparison was done with one-way ANOVA (p < 0.05) and Tukey’s post hoc (p <0.05) test.
Supplementary Table 1. Transcription factors that are predicted by prediction algorithms, MotifScanner and CisGenome, to regulate the expression of all 4 miRNAs within 5000 base pairs upstream of each miRNA. The commons factors predicted for all 4 miRNAs were listed in the table.
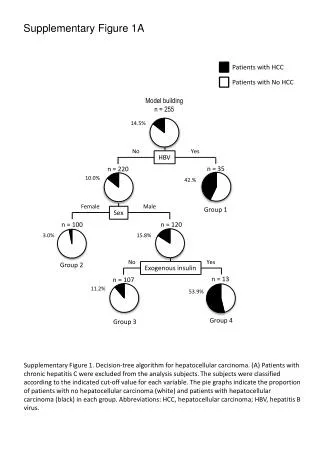
* * * * * Fold change Supplementary Figure 5. Expression of PAI-1was examined upon stimulation with TGF-β with or without TGF-β inhibitorin indicated GBM cell lines. Bar graphs were generated with Mean ± S.D. of 3 independent experiments. Comparison was done with one-way ANOVA (p < 0.05) and Tukey’s post hoc (p < 0.05) test.
Supplementary Table 2. Selected genes from our predictions that overlap with the list of factors whose silencing cause radioresistance have been shown in Table 2.