Impact of BA on Survival and Lymphocyte Response in RRV-Infected Balb/c Mice
50 likes | 172 Views
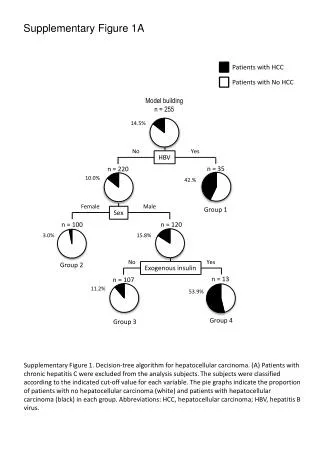
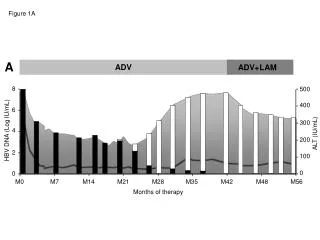
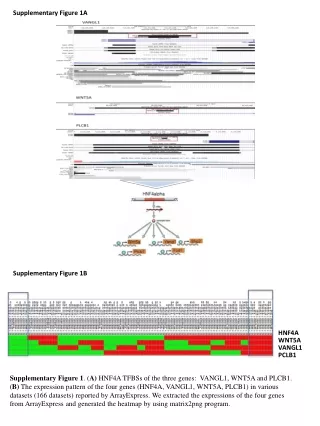
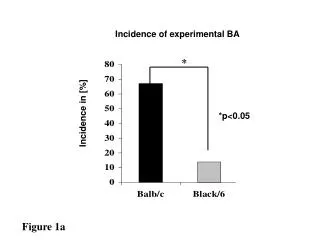
This study investigates the incidence of experimental BA and its effect on survival rates in Balb/c mice post-RRV infection. The results indicate a statistically significant difference in survival percentages (*p < 0.05*) and analyze the counts of CD3, CD4, and CD8 lymphocytes. The findings are visualized in Figures 1 and 2, illustrating the variations in T cell responses among different conditions. The data highlight the immune dynamics influenced by BA in the context of viral infections.

Impact of BA on Survival and Lymphocyte Response in RRV-Infected Balb/c Mice
E N D
Presentation Transcript
Incidence of experimental BA * Incidence in [%] *p<0.05 Figure 1a
Balb/c Black/6 died died Survival [%] days after RRV infection Figure 1b
CD3 lymphocytes * * * 30 20 T cells/0.25 mm2 10 0 +BA - BA cont +BA - BA cont Black/6 Balb/c *p<0.05 Figure 2a
CD4 lymphocytes * * * T cells/0.25 mm2 +BA - BA cont +BA - BA cont Balb/c Black/6 *p<0.05 Figure 2b
CD8 lymphocytes T cells/0.25 mm2 +BA - BA cont +BA - BA cont Balb/c Black/6 Figure 2c