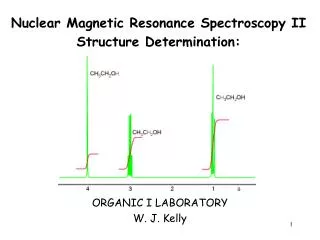
Structure Determination by Spectroscopy
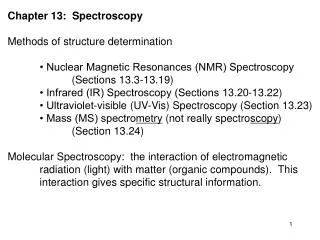
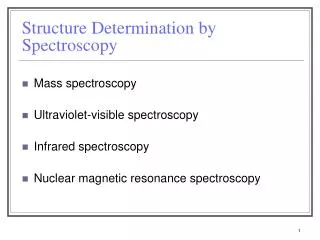
Structure Determination by Spectroscopy. Mass spectroscopy Ultraviolet-visible spectroscopy Infrared spectroscopy Nuclear magnetic resonance spectroscopy. Mass Spectroscopy. Mass spec gives information about the molecular weight, and thus the formula, of a molecule.

Structure Determination by Spectroscopy
E N D
Presentation Transcript
Structure Determination by Spectroscopy • Mass spectroscopy • Ultraviolet-visible spectroscopy • Infrared spectroscopy • Nuclear magnetic resonance spectroscopy
Mass Spectroscopy • Mass spec gives information about the molecular weight, and thus the formula, of a molecule. • A sample is vaporized and bombarded with high energy electrons. The impact ejects an electron from the sample to give a radical cation. A-B [A.B]+. + e- • The cation is detected and recorded as the M+ (molecular cation) peak, usually the highest mass peak in the spectrum. • The M+ peak gives the molecular weight of the compound. • The mass / charge (m/z) ratio is always an even number except when the molecule contains an odd number of Nitrogen atoms.
Mass Spectroscopy • Isotopes have different atomic weights and so can be separated by the spectrometer. • Halogens can be identified by their isotope ratios. • 35Cl and 37Cl in a 3:1 ratio • 79Br and 81Br in a 1:1 ratio • 127I is the natural isotope
Mass Spectroscopy • The radical cation can fragment to a radical (no charge) and a cation. [A.B]+. A + B+or A+ + B • Only the cations are detected in the mass spectrometer. • The most intense peak is called the “Base Peak”, which is arbitrarily set to 100% abundance; all other peaks are reported as percentages of abundance of “Base Peak.” • Different groups of atoms will fragment in characteristic ways.
Interaction of electromagnetic radiation energy and matter • When EMR is directed at a substance, the radiation can be: • Absorbed • Transmitted • Reflected depending on the frequency (or wavelength or energy) of the radiation and the structure of the substance.
Mathematical Relationships E = h E = hc / c = = Frequency (Hz)c = Velocity of Light (3 x 1010 cm/sec) = Wavelength (cm) h = Planck’s Constant (6.62 x 10⁻²⁷ erg-sec)
Interaction of electromagnetic radiation energy and matter • Molecules exist only in discrete states that correspond to discrete energy content. • The EMR energy that is absorbed is quantized and brings about certain specific changes in the molecule. • electronic transitions (UV-vis) • vibrations (IR) • rotations (IR)
Interaction of electromagnetic radiation energy and matter • Exact energies absorbed by a molecule are highly characteristic of the structure and are unique for each compound. • spectroscopic “fingerprint” • Similar functional groups absorb similar energies regardless of the structure of the rest of the compound.
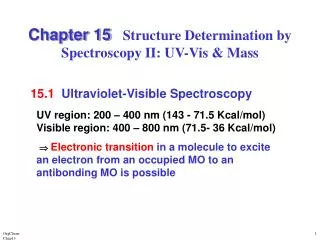
UV-visible Spectroscopy • Ultraviolet: 200 nm – 400 nm Visible: 400 nm – 800 nm • Most organic molecules and functional groups do not absorb energy in the UV-visible part of the EMR spectrum and thus, absorption spectroscopy in the ultraviolet-visible range is of limited utility. • When a molecule does absorb in the UV-vis, the energy transitions that occur are between electronic energy levels of valence electrons, that is, electrons in orbitals of lower energy are excited to orbitals of higher energy. • Energy differences generally of 30 –150 kcal/mole
C : H C::C UV-visible Spectroscopy • The ground state of an organic molecule can contain valence electrons in three principal types of molecular orbitals: • (sigma) • (pi) • n (non-bonding)
UV-visible Spectroscopy • Electrons in sigma bonds (single bonds) are too tightly bound to be promoted to a higher energy level by UV-visible radiation. • alkanes, alcohols, alkyl halides, simple alkenes do not absorb in the UV • Electrons in pi bonds and non-bonding orbitals are more loosely held and can be more easily promoted. • Conjugation of pi bonds lowers the energy of the radiation that is absorbed by a molecule. • Conjugated unsaturated systems are molecules with two or more double or triple bonds each alternating with a single bond. • If a molecule does not absorb in the UV, then it does not contain a conjugated system of alternating double bonds or a carbonyl group.
Infrared Spectroscopy • Infrared • almost all organic compounds absorb in this region between the visible and radiowaves • 800 nm (12,500 cm-1) to 107nm (1.0 cm-1) • Area of greatest interest in organic chemistry is the vibrational portion • 2,500 nm (4,000 cm-1) to 15,000 nm (~700 cm-1)
Infrared Spectroscopy • Radiation in the vibrational infrared region is expressed in frequency units called wave numbers, which are the reciprocal of the wavelength () expressed in centimeters. (cm-1) = 1 / (cm) (cm-1) = (nm-1) x 107 • Wave numbers can be converted to energyby multiplying by hc. Thus wave numbers are proportional to energy.
Infrared Spectroscopy • Molecular Vibrations • Absorption of infrared radiation corresponds to energy changes on the order of 8-40 KJ/mole (2-10 kcal/mol) • The frequencies in this energy range correspond to the stretching and bending frequencies of covalent bonds, that is, changes in bond length and bond angle. • Two uses for IR: • IR spectra can be used to distinguish one compound from another (“fingerprint”) • Information about the functional groups present in a compound
Summary • Identify functional groups that are present or absent, using Pavia’s sections • Do not over-analyze an IR spectrum – there is usually complementary information from other sources to identify the compound • Not every peak can be identified, so don’t try • Look at lots of examples!