Download
1 / 64
870 likes | 1.68k Views
12. Structure Determination: Mass Spectrometry and Infrared Spectroscopy. Determining the Structure of an Organic Compound. The analysis of the outcome of a reaction requires that we know the full structure of the products as well as the reactants

E N D
12. Structure Determination: Mass Spectrometry and Infrared Spectroscopy
Determining the Structure of an Organic Compound • The analysis of the outcome of a reaction requires that we know the full structure of the products as well as the reactants • In the 19th and early 20th centuries, structures were determined by synthesis and chemical degradation that related compounds to each other • Physical methods now permit structures to be determined directly. We will examine: • mass spectrometry (MS) • infrared (IR) spectroscopy • nuclear magnetic resonance spectroscopy (NMR) • ultraviolet-visible spectroscopy (VIS)
Why this Chapter? • Finding structures of new molecules synthesized is critical • To get a good idea of the range of structural techniques available and how they should be used
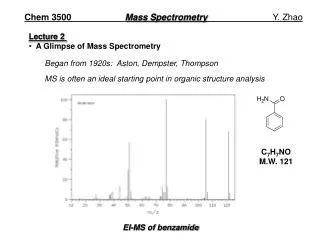
12.1 Mass Spectrometry of Small Molecules:Magnetic-Sector Instruments Bonds in cation radicals begin to break (fragment) Sample vaporized and subjected to bombardment by electrons that remove an electron creating a cation radical Mass to charge (m/z) ratio is measured Molecular ion (M+) shows molecular weight
The Mass Spectrum • Plot mass of ions (m/z) (x-axis) versus the intensity of the signal (roughly corresponding to the number of ions) (y-axis) • Tallest peak is base peak(100%) • Other peaks listed as the % of that peak • Peak that corresponds to the unfragmented radical cation is parent peak or molecular ion (M+) Propane MW = M+ = 44
12.2 Interpreting Mass Spectra • Molecular weight from the mass of the molecular ion • Double-focusing instruments provide high-resolution “exact mass” • 0.0001 atomic mass units – distinguishing specific atoms • Example MW “72” is ambiguous: C5H12 and C4H8O but: • C5H12 72.0939 amu exact mass C4H8O 72.0575 amu exact mass • Result from fractional mass differences of atoms 16O = 15.99491, 12C = 12.0000, 1H = 1.00783 • Instruments include computation of formulas for each peak • If parent ion not present due to electron bombardment causing breakdown, “softer” methods such as chemical ionization are used
M+ peak Example: • Possible formulas can be determined from the mass. (M+) Predict possible molecular formulas containing C, H, and maybe O if : M+ = 86 M+ = 156
M+ peak Example: • Possible formulas can be predicted from the mass. (M+) Predict possible molecular formulas containing C, H, and maybe O if : M+ = 86 M+ = 156 C6H14 C5H10O C4H6O2 C3H2O3 C11H24 C12H12 C11H8O C10H20O C10H4O2 C9H16O2 C8H12O3 C7H8O4 C6H4O5
M+ peak : • Peaks above the molecular weight appear as a result of naturally occurring heavier isotopes in the sample • (M+1) from 1.1% 13C in nature • (M and M+2) in 75.8%/24.2% ratio = 35Cl and 37Cl • (M and M+2) in 50.7%/49.3% ratio = 79Br and 81Br Propane MW = M+ = 44 M+1 = 45 From 1.1% 13C
Click on image to enlarge M+ peak: Halides • M+ and M+2 in 75.8%:24.2% (~ 3:1) ratio • = 35Cl and 37Cl • M+ and M+2in 50.7%:49.3% (~ 1:1) ratio • = 79Br and 81Br CH3Cl
Mass-Spec Fragmentation Patterns • Molecular ions break into characteristic fragments that can be identifed • Serves as a “fingerprint” for comparison with known materials in analysis (used in forensics) • Positive charge goes to fragments that best can stabilize it
Mass-Spec Fragmentation Patterns M -15 = 57 CH3=15 MW=72; M+ peak not seen
Mass Spec: Fragmentation of Hexane Hexane (m/z = 86 for parent) has peaks at m/z = 71, 57, 43, 29 71=Loss of CH3 (15) 57=Loss of CH3CH2 (29)
Learning Check: Identify the following MS as that of methylcyclohexane or ethylcyclopentane.
Solution: Identify the following MS as that of methylcyclohexane or ethylcyclopentane. 98-69=29 loss of (CH3CH2) 98-83=15 (loss of CH3) M+ =98
Learning Check: Identify the following MS as that of methylcyclohexane or ethylcyclopentane.
Solution: Identify the following MS as that of methylcyclohexane or ethylcyclopentane. 98-83=15 (loss of CH3) M+ =98
12.3 Mass Spec: Common Functional Groups Alcohols: • Alcohols undergo -cleavage (at bond next to the C-OH) as well as loss of H-OH (18) to give C=C Loss of 18
Mass Spec: Amines • Nitrogen Rule: Amines with odd # of N’s have Odd M+ • Amines undergo -cleavage, generating radicals
Mass Spec: Carbonyl Compounds • A C-H that is three atoms away leads to an internal transfer of a proton to the C=O, called the McLafferty rearrangement Loss of 28 • Carbonyl compounds can also undergo cleavage
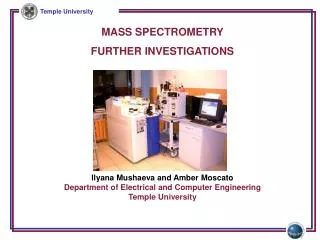
12.4 Mass Spectrometry in Biological Chemistry: Time-of-Flight (TOF) Instruments • Most biochemical analyses by MS use: • electrospray ionization (ESI) • Matrix-assisted laser desorption ionization (MALDI) • Linked to a time-of-flight mass analyzer MALDI-TOF MS of chicken eg-white lysozyme
12.5 Spectroscopy and the Electromagnetic Spectrum • Radiant energy is proportional to its frequency (cycles/s = Hz) as a wave (Amplitude is its height) • Different types are classified by frequency or wavelength ranges
Electromagnetic Spectrum High frequency (u) Short wavelength (l) = High energy Low frequency (u) Long wavelength (l) = Low energy
Absorption Spectra • Organic compound exposed to electromagnetic radiation, can absorb energy of certain wavelengths. • Changing wavelengths to determine which are absorbed and which are transmitted produces an absorption spectrum • Energy absorbed is shown as dips in spectrum High frequency (u) Short wavelength (l) = High energy Infrared Absorption of Ethyl Alcohol CH3CH2OH Low frequency (u) Long wavelength (l) = Low energy
12.6 Infrared Spectroscopy • IR region lower energy than visible light (< red – produces heating as with a heat lamp) • 2.5 106 m to 2.5 105m region used by organic chemists for structural analysis • IR energy in a spectrum is usually measured as wavenumber (cm-1), the inverse of wavelength and proportional to frequency • Specific IR absorbed by organic molecule related to its structure High frequency = High E Low frequency = Low E
Infrared Spectroscopy • IR energy absorption corresponds to atomic movements, such as vibrations and rotations from bending and stretching of bonds between groups of atoms • Energy is characteristic of the bonding of atoms in a functional group • Bond stretching dominates higher energy modes • Light objects connected to heavy objects vibrate fastest: C-H, N-H, O-H • For two heavy atoms, stronger bond requires more energy: C º C, C º N > C=C, C=O, C=N > C-C, C-O, C-N, C-halogen
4000-2500 cm-1 N-H, C-H, O-H (stretching) 3300-3600 N-H, O-H 3000 C-H 2000-1500 cm-1 double bonds C=C, C=O, C=N (stretching) C=O 1680-1750 C=C 1640-1680 cm-1 12.7 Interpreting Infrared Spectra • Most functional groups absorb at a characteristic energy Below 1500 cm-1 “fingerprint” Single bonds C-C, C-O, C-N, C-X (vibrations) 2500-2000 cm-1 CºC and C º N (stretching)
Infrared Spectra: Functional Grps • Characteristic higher energy IR absorptions used to confirm the existence of the presence of functional groups
12.8 IR Spectra: Functional Grps Alkane C-C -C-H Alkene Alkyne
IR: Aromatic Compounds (Subsituted benzene “teeth”) C≡C
IR: Alcohols and Amines O-H broadens with Hydrogen bonding CH3CH2OH C-O N-H broadens with Hydrogen bonding Amines similar to OH
IR: Alcohols: O-H stretch Gas phase (no H-bonding) CCl4 sln (0.25M) (some H-bonding) Liquid Film (Lots of H-bonding)
IR: Alcohols C-O
IR: Amines • Primary and secondary amines exhibit a characteristic broad IR N-H stretching absorption between 3250 and 3500 cm-1. • Primary amines show two strong peaks in this range, whereas secondary amines show only one. • Primary amines also show a band near 1600 cm-1 due to a scissoring motion of the NH2 group. • Tertiary amines do not show any of these signals since they do not have a hydrogen bound to nitrogen. Amines similar to OH N-H broadens with Hydrogen bonding
IR: Carbonyls: C=O Aldehydes • Carbonyls in general: • Strong, sharp C=O peak 1670 to 1780 cm1 • Conjugation lowers stretching frequency
IR: C=O: Ketones Conjugation with a double bond or benzene ring lowers the stretching frequency by 30 to 40 cm-1.
IR: C=O: Ketones • Ring strain increases frequency: • Incorporation of the carbonyl group in a small ring (5, 4 or 3-membered), raises the stretching frequency.
IR: C=O: Esters • 1735 cm1 in saturated esters • Electron donating O increased the frequency • 1715 cm1 in esters next to aromatic ring or a double bond • Conjugation decreases the frequency
Learning Check: 32. Which of the following represents cyclohexane and which cyclohexene?
Solution: 32. Which of the following represents cyclohexane and which cyclohexene? =C- H -C-H -C=C-
Learning Check: 41.Propose a structure for the following unknown hydrocarbon:
Solution: 68-53 =15 loss of CH3 41.Propose a structure for the following unknown hydrocarbon: M-1=67 C5H8 2 deg of unsat M=68 ≡C- H -C≡C- -C-H
Learning Check: 42. Propose a structure for the following unknown hydrocarbon:
Solution: 42. Propose a structure for the following unknown hydrocarbon: 70-55 =15 loss of CH3 C5H10 M=70 -C-H =C-H -C=C-
In mass spectrometry, what term is used to describe the ion that results from the ejection of one electron from a molecule? • base peak • parent peak • fragment • analyte • none of these
What quantity is detected by mass spectrometry? • the energy of a molecule • the number of electrons ejected from a molecule • the number of ions of a particular mass to charge ratio • the number of electrons needed to ionize a molecule • the number of hydrogen atoms in a molecule