Download
1 / 16
160 likes | 344 Views
Current Trends in Revenue Cycle Performance Benchmarks and Outsourcing January 21, 2011. Discussion Outline. Assessment Conclusions Discussion Objectives and Approach Process Definition Leading Practice Comparison Trends in Outsourcing . Relevance .

E N D
Current Trends in Revenue Cycle Performance Benchmarks and Outsourcing January 21, 2011
Discussion Outline • Assessment Conclusions • Discussion Objectives and Approach • Process Definition • Leading Practice Comparison • Trends in Outsourcing © 2011 Huron Consulting Group. All rights reserved. Proprietary & Confidential.
Relevance © 2011 Huron Consulting Group. All rights reserved. Proprietary & Confidential.
What do you Consider the Revenue Cycle ? • Definition of Revenue Cycle Almost all processes and inputs can have measurement tailored that targets opportunities across a hospital or professional fee revenue cycle. Key Selection Factors: Accuracy, Relevance, Actionable © 2011 Huron Consulting Group. All rights reserved. Proprietary & Confidential.
Definitions Benchmarks, performance standards, • A performance standard by which something can be measured or judged • A measure of performance of a process relative to another similar item in an impartial scientific manner • Benchmarks can be # or other process performance indicators What isn’t a benchmark or performance standard • Simple counting : How much is there? How many there are of something? What you we quantify - That’s Measurement …. • Tracking outcomes or volumes across a set of similar processes / locations without ownership - That’s pointless comparison What destroys benchmark value • Normalization • Poor alignment - or does your team find value in the measure © 2011 Huron Consulting Group. All rights reserved. Proprietary & Confidential.
The Error of Normalizing Data © 2010 Huron Consulting Group. All rights reserved. Proprietary & Confidential.
Critical Success Factors • Measure to improve …. Not to promote • Measurement should foster distributed accountability …..personal ownership • Invest in automation of measurement and report production • Stability is as important as relevancy! If a performance report, data elements, format or distribution frequency changes it is viewed as less relevant • Standards can be internal or external to your organization • Don’t be a snob - e.g. UHC • Don’t normalize a national / regional / benchmark … • Can’t find a relevant benchmark? Set relevant performance comparisons • Requires more frequent review for relevancy • Align with performance standards – benchmarks - real $ • This is not an academic exercise . © 2011 Huron Consulting Group. All rights reserved. Proprietary & Confidential.
Leading Practice Comparison • Current Performance Metrics and Practices Below Average Performance/Not Measured = / Average Performance = / Strong Performance = © 2011 Huron Consulting Group. All rights reserved. Proprietary & Confidential.
Leading Practice Comparison • Current Performance Metrics and Practices (continued) © 2011 Huron Consulting Group. All rights reserved. Proprietary & Confidential.
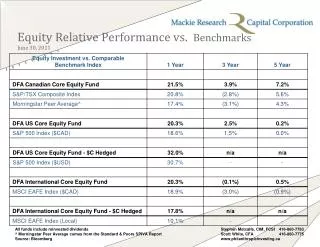
Other High Level Revenue Cycle Benchmarks CategoryStockamp Targets • Accounts have timely, proactive, > 90%and effective processing • Follow-up Quality > 75% • Avoidable Administrative Codes <1.5% of NR • Total AR Agings 360+ <3% • Total AR Agings 90+ <19% • Bad Debt Write-Off Codes <3% of NR • Billing Work In Process 3 days ADR • Net AR Days <40 days • POS Collections 1% of NPSR © 2011 Huron Consulting Group. All rights reserved. Proprietary & Confidential.
Analysis Process • Active A/R Account Reviews – Account Processing Activity • Performance Measure Objective: Determine opportunity for cash flow / process improvement by reviewing the frequency, quality, and effectiveness of account processing activity (e.g., billing, follow-up, appeals) • Leading Practice: Every Supervisor needs to be able to explain the measure • More than 90% of accounts have timely, proactive, and effective processing • Proactive processing occurs at least every 30 days for accounts over $1,000 and more frequently for accounts over $10,000 • All processing activity (including vendor activity) is thoroughly documented • What are the main areas of process breakdown: • Coding issues delaying billing • Large gaps in follow-up • Interdepartmental hand-offs including medical record requests • Coordination of benefits • Lack of escalation impacting account resolution Account Processing Activity (% of accounts) Not Timely, Proactive, or Effective 50% Timely, Proactive, and Effective22% No Documentation28% © 2011 Huron Consulting Group. All rights reserved. Proprietary & Confidential.
Analysis Process • Active A/R Account Reviews – Denials Management • Measurement Objective: Determine opportunity for cash flow improvement by reviewing the frequency and impactability of denials (e.g., authorization, timely filing, missing documentation) • Leading Practice: Supervisor presents • <5% of accounts receive impactable denials • Appeal steps and status are thoroughly documented • Denial Trends Observed in Reviews: • Approximately 13% of the accounts reviewed received an impactable denial • Approximately 22% of the accounts reviewed received a potentially impactable denial • Appeal steps and status were not thoroughly documented Summary of Impactable and Potentially Impactable Denials (% of accounts) Eligibility / Authorization 25% Other 19% Coding / Documentation 14% Timely Filing 10% © 2011 Huron Consulting Group. All rights reserved. Proprietary & Confidential.
Tools Executive Dashboards and Operational Reporting Timely information regarding overall revenue cycle performance is critical to effective decision making. Business Intelligence Communication between and within departments is critical to viewing the revenue cycle as a holistic business process. Automated Workflow Work drivers guide an individual’s day-to-day work. They must be consolidated and presented in a way to reinforce an accountable, proactive environment. Consistent Work Drivers Staff Performance Management Reporting Daily Workdrivers © 2011 Huron Consulting Group. All rights reserved. Proprietary & Confidential.
Outsourcing Trends Knowledge Transfer Flexible Contract Terms with Shared Risk Accelerated Cash & Reduction of A/R People | Best Practice Process | Technology Qualitative & Quantitative Reporting Utilizing & Optimizing Tools to enhance Performance Patient Centric Example: Some vendor programs are designed to audit and correct 100% of patient registrations, specifically evaluating data completeness and accuracy of patient demographic and insurance information. The program blend of automation and people power to make corrections prior to the time of service or bill drop. © 2011 Huron Consulting Group. All rights reserved. Proprietary & Confidential.
Remember Tucson © 2010 Huron Consulting Group. All rights reserved. Proprietary & Confidential.