Download
1 / 55
550 likes | 676 Views
Estimating the freshwater budget of high-latitude land surfaces. Laura C. Bowling Ph.D. Defense August 21st, 2002. Presentation Outline. Introduction Dissertation Synopsis Pan-Arctic model simulation Hydrologic effects of lakes and wetlands Sublimation of blowing snow

E N D
Estimating the freshwater budget of high-latitude land surfaces Laura C. Bowling Ph.D. Defense August 21st, 2002
Presentation Outline • Introduction • Dissertation Synopsis • Pan-Arctic model simulation • Hydrologic effects of lakes and wetlands • Sublimation of blowing snow • Exploratory Analysis of Model Sensitivity • Lakes: Runoff hydraulics • Blowing Snow: Relative humidity • Summary and Recommendations
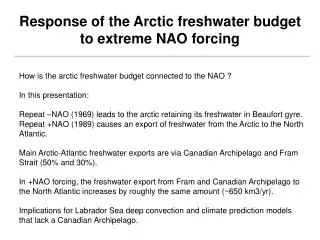
Observed cryosphere changeSea ice extent Source: W.M.O. Statement on the Status of Global Climate in 2000
Arctic discharge trends Summer Winter Annual
Thermohaline Circulation G. Holloway, Institute of Ocean Sciences, Sidney, BC
Arctic drainage basin Mackenzie Lena Ob Yenesei
Previous studies of macroscale models in arctic environments • Include PILPS 2d, PILPS 2e and Bowling et al. 2000 • Identified limitations in model representations, including: • lakes and wetlands, • permafrost and frozen ground • blowing snow
Meteorological Inputs • Station data interpolated to 1/8o latitude by longitude grid • 1986 - 2001 • Relative humidity, air temperature and wind speed • 8 WERC stations • Hourly data • Precipitation • 2 NRCS gauges with Wyoming wind shields • 2 NCDC stations with NWS 8” gauges • Corrected for wind-induced gauge undercatch • Daily data
Annual average precipitation Unadjusted % difference Adjusted
Lakes and wetlands Source: San Diego State University Global Change Research Group
Prudhoe Bay Landcover from Landsat MSS images (Muller et al. 1999).
Spring water balance 1999 2000 2001
Snow melt water balance 1999 2000 2001
Predicting the effects of lakes and wetlands • Lake energy balance based on: • Hostetler and Bartlein (1990) • Hostetler (1991) • Assumptions: • One “effective” lake for each grid cell; • Laterally-averaged temperatures; and • Rule curve for release of runoff from grid cell lake.
Mean daily values, June-August 2000 Lake surface energy balance Mean diurnal values, June-August 2000 ‘Lake 1’, Arctic Coastal Plain, Alaska
Mean temperature profile (1993-1997)Toolik Lake, Alaska ObservedSimulated
Lake ice formation and break-upTorne River, Sweden ice break-up ice formation
soil saturated land surface runoff enters lake evaporation depletes soil moisture lake recharges soil moisture Wetland Algorithm
with lake algorithm without lake algorithm Simulated mean annual evaporation • Simulated annual evaporation increases by 60%
Blowing Snow Günter Eisenhardt 3.31.2002, Iceland
Snow accumulation SWE > 0? Blowing snow sublimation Snow mass and energy balance Yes No Predictive model of the sublimation from blowing snow • Derived from existing small-scale blowing snow models (Pomeroy et al. 1993 and Liston and Sturm 1998). • Mass concentration of suspended transport based on power law relationship (Kind 1992). • Particle sublimation rate proportional to the undersaturation of water vapor. = VIC snow model
Overstory? Blowing sublimation = 0 Yes Yes No Percentile wind speed Snow accumulation SWE > 0? Saltation Snow mass and energy balance Fetch adjustment No Total transport and Sublimation Probability of blowing snow Final percentile? Blowing sublimation Yes No
Overstory? Blowing sublimation = 0 Yes Yes No Percentile wind speed Snow accumulation SWE > 0? Saltation Snow mass and energy balance Fetch adjustment No Total transport and Sublimation Probability of blowing snow Final percentile? Blowing sublimation Yes No
Distribution of terrain slopes Trail Valley Creek, NWT Imnavait Creek, Alaska
Sub-grid variability in wind speed • Wind speeds assumed to follow a Laplace distribution • Standard deviation of wind speed proportional to the mean wind speed, standard deviation of terrain slope and gradient autocorrelation of terrain • Total sublimation flux found by summing sublimation for the average wind speed of ten equally-probable intervals
Overstory? Blowing sublimation = 0 Yes Yes No Percentile wind speed Snow accumulation SWE > 0? Saltation Snow mass and energy balance Fetch adjustment No Total transport and Sublimation Probability of blowing snow Final percentile? Blowing sublimation Yes No
Estimating average fetch vegetation type terrain slope terrain st. dev
Simulated annual sublimation from blowing snowSensitivity to fetch
Model Sensitivity and Limitations • Low-gradient runoff hydraulics
Model Sensitivity and Limitations • Low-gradient runoff hydraulics • Vapor pressure uncertainty
Sensitivity to vapor pressure Average annual surface sublimation: RH w.r.t. ice -5.3 mm RH w.r.t water -9.2 mm Tdew = Tmin 6.6 mm
Summary - water balance of arctic coastal regions lakes and wetlands • 60 to 74% of snow melt water goes into storage and is not immediately available for runoff • Between 50 and 64% of the stored meltwater is depleted by evaporation from open water areas. • Evaporation and drainage result in a seasonal reduction of the extent of surface water bodies of 58 to 73%. • The presence of extensive open water effects the spatial distribution of simulated evaporation. Basin annual evaporation is 60% higher (26 mm) when the lakes are simulated.
Summary - water balance of arctic coastal regions Blowing snow • Annual average sublimation from blowing snow varies from 55 mm in the foothills to approximately 25 mm on the coastal plain. • It is impossible to estimate blowing snow transport at large spatial scales without some estimate of the distribution of wind speeds. • The simulated blowing snow sublimation is sensitive to estimates of upwind fetch in regions of complex terrain.
Recommendations for further work • Tundra runoff processes and the influence of snow dams in low gradient arctic rivers • Implications of relative humidity on the mid-winter snow pack energy balance • What is to be done about precipitation in regions with sparse data, that is getting sparser?