Download
1 / 15
150 likes | 236 Views
Analysis of Antarctic freshwater fluxes in ECCO2 model, implications on global ocean, ice mass loss, and implications beyond Antarctic Circumpolar Current, using high-resolution ocean and sea-ice data synthesis techniques. Investigating circulation and climate impact.

E N D
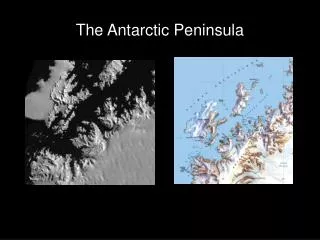
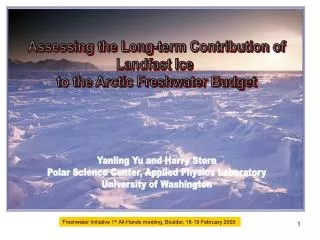
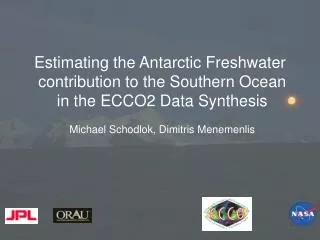
Estimating the Antarctic Freshwater contribution to the Southern Ocean in the ECCO2 Data Synthesis Michael Schodlok, Dimitris Menemenlis
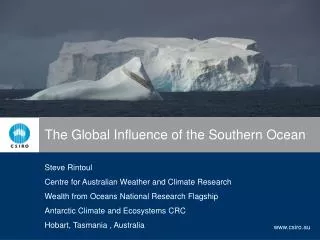
Motivation – ECCO2 Model – Freshwater Fluxes – Implications – Summary Antarctic Ice Mass Loss How much of the mass loss is contributed to basal melting? How much of the mass loss to iceberg calving? Do we capture the mass loss in the freshwater fluxes in our model? Preconditioning to ice shelf disintegration? What is the impact on the global ocean? E. Rignot
Motivation – ECCO2 Model – Freshwater Fluxes – Implications – Summary Circumpolar Freshwater Fluxes Iceberg calving : 2016 Gt/a => 70 mSv (Jacobs et al. 1992) NCEP-Precipitation: 38.62 mSv for 2.7 x 10⁶ km2 circumpolar continental shelf (h < 500 m) Ice shelf basal melting (BRIOS): 906 Gt/a => 28 mSv (circumpolar) - Hellmer 2004 Modeling without iceshelves: Sea ice thinning, increase of bottom salinity (Hellmer 2004) Implications beyond Antarctic Circumpolar Current (Hellmer et al., 2005 Schodlok et al., 2007)
Motivation – ECCO2 Model – Freshwater Fluxes – Implications – Summary regional sub-domain Estimating the Circulation and Climate of the Ocean, Phase II: High Resolution Global-Ocean and Sea-Ice Data Synthesis • Model Set up: • Ocean model MITgcm • z-coordinates (shaved cells) • 6 `Faces` à 510x510 ~ 18 km • 50 vertical layers • ECCO2 data syntheses are obtained by • least squares fit to available satellite • and in-situ data • An objective function expresses • the extent of optimization: J = uTQ-1u + nTR-1n http://ecco2.jpl.nasa.gov
Motivation – ECCO2 Model – Freshwater Fluxes – Implications – Summary ICEsat/GLAS: DEM (E. Rignot) BEDMAP: Water Column Thickness -> Firnlayer correction => Draft + Water Column Thickness = Cavity Bathymetry Bathymetry: Smith and Sandwell 2008, 1 min, v11.1 Amery Data – Ben Galton-Fenzi (UTAS) Amundsen Sea bathymetry – Frank Nitsche (LDEO) WAIS/SGLOBEC – Mike Dinniman (ODU) Antarctic Ice Shelves in ECCO2 Integration Period: 1979 - 2007 OBCS: from optimised Cube78 solution Surface forcing: ERA40-ECMWF blend
Motivation – ECCO2 Model – Freshwater Fluxes – Implications – Summary Thickness [m] Antarctic Ice Shelves in ECCO2
Motivation – ECCO2 Model– Freshwater Fluxes – Implications – Summary Freezing dh/dt > 0 Melting dh/dt < 0 1979 - 2007 Strong melting in Amundsen – Bellingshausen Seas Melting in Eastern Weddell Sea Melting and freezing pattern in three major ice shelves
Motivation – ECCO2 Model– Freshwater Fluxes – Implications – Summary Circumpolar FWF 57 mSv ± 7 mSv 28 mSv (Hellmer 2004) ~55 mSv(E. Rignot) Weddell Sea: 3.51 mSv ECCO2 9.10 mSv(Timmermann, 2001) Jacobs et al., 1996;Hellmer, 2004; Thoma, 2005; Smedsrud et al, 2006;Payne et al., 2007
Motivation – ECCO2 Model– Freshwater Fluxes – Implications – Summary ICESAT/GLAS observation estimates (E Rignot) ECCO2 Model estimates [m/a] Shackleton/ Moscow Ross Sea Weddell Sea Amery ROSS WAIS Filchner Ronne all ice shelves Ross Sea ROSS
Motivation – ECCO2 Model– Freshwater Fluxes – Implications – Summary ~5 cm/yr decreased melting increased melting ~3.5 cm/yr Circumpolar Freezing and Melting Trends
Motivation – ECCO2 Model– Freshwater Fluxes– Implications – Summary ~3 ~6 ~3 ~10 ~7 ~6 ~10 Wavelet Analysis: maximum spectral power at around 1 year – seasonal cycle the 7 year mode dominates during the 90ties for major ice shelves correlation to SOI or SAM?
Motivation – ECCO2 Model– Freshwater Fluxes– Implications – Summary ISW HSSW melting freezing Ross Sea Freezing/Melting Pattern Lower maximum melting compared to e.g. Holland et al., (2003)
Motivation – ECCO2 Model– Freshwater Fluxes– Implications – Summary Meridional Overturning with and without ocean ice shelf interaction (IS) without IS: 9.30 Sv at 28.3 kg/m3 -19.43 Sv at 27.7 kg/m3 with IS: 5.62 Sv at 28.2 kg/m3 -20.91 Sv at 27.5 kg/m3 1979 - 2007
Summary and Outlook Motivation – ECCO2 Model– Freshwater Fluxes– Implications– Summary • FWF doubled compared to previous circumpolar estimates • similar order of magnitude to satellite derived estimates with • large deviations in the WAIS and Shackleton IS areas. • no positive FWF trend in our model results • implementation in global ECCO2 model run (cube86) • underway • correlate dominant periods to SAM/SOI
Thanks for your attention Thanks to D. Halkides, A. Kahzendar, A. Fetter, A. Nguyen Thanks to Oak Ridge Associated Universities