Download
1 / 12
120 likes | 177 Views
Learn how to estimate animal populations using the Lincoln Index and plant populations via Quadrat Estimation. Discover the principles, assumptions, and methods for calculating population density and diversity.

E N D
Estimating Populations of Animals • Lincoln index (capture-mark-release-recapture) n1 x n2 N = m • N = Total number of population • n1 = Number of animals first (mark all of them) • n2= Number of animals captured in second sample • m= Number of marked animals in second sample Ex. 40 mice were caught, marked (tail tattoo) and released. Later, 10 mice were recaptured, 4 of which had tattoo marks.
Lincoln Index Assumptions • The marked animals are not affected (neither in behavior nor life expectancy). • The marked animals are completely mixed in the population. • The probability of capturing a marked animal is the same as that of capturing any member of the population. • Sampling time intervals must be small in relation to the total time of experiment of organisms life span. • The population is closed (no immigration and emigration) • No births or deaths in the period between sampling.
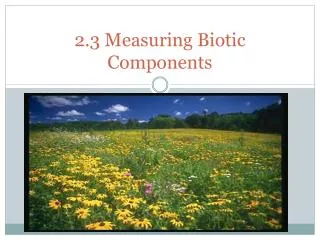
Estimating Populations of Plants • Quadrat Estimation • Population Density- The number of plants within the given area of the quadrat (m2) • Percentage Coverage- How much of the area of a quadrat is covered by plants? • Frequency- How often does a plant occur in each quadrat? • Acacia senegalensis was present in 47 of 92 quadrats, for a frequency of 51%
Calculate Population Density What is the population density of species x ? What is the population density of species w? What is the population density of species Z? Quadrat 1= 0.5m2
Calculate Percentage Coverage What is the percentage of plant coverage in this quadrat? Quadrat 1= 0.5m2
Percentage Frequency Quadrat 1 What is the frequency of species X? What about species V? Quadrat 2 Quadrat 3
Other Methods of Estimation(Plants) • Sampling – Take a sample from one area and assume the organisms are evenly spread out through the area. • Biomass (dry weight) of living tissue • We use dry weight because water is non-living and needs to be excluded • Ex. 10 ferns were found in a 100m2 area. How many ferns would be in 1000m2 field in the same ecosystem?
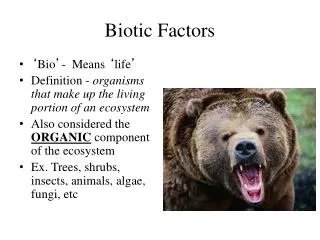
What is diversity? • Diversity is the variety of life • Diversity is a combination of two components • Abundance: The number individuals of each species present in a sample • Richness: The total number of different species in a sample
How Can We Know Diversity? Use the Simpsons diversity index below