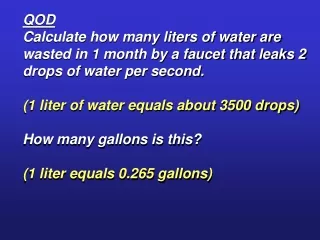
Download
1 / 22
230 likes | 245 Views
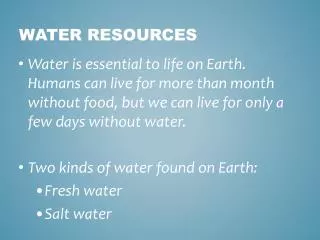
Explore water resources, including freshwater, groundwater, rivers, lakes, and oceans. Learn about precipitation, evaporation, and managing water demand. Discover challenges like water shortages and excess, and solutions for sustainable water use.

E N D
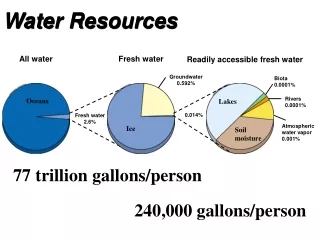
Water Resources All water Fresh water Readily accessible fresh water Groundwater 0.592% Biota 0.0001% Rivers 0.0001% Oceans Lakes Lakes 0.007% 0.014% Fresh water 2.6% Oceans and saline lakes 97.4% Ice caps and glaciers 1.984% Atmospheric water vapor 0.001% Soil moisture 0.005% Ice Soil moisture 77 trillion gallons/person 240,000 gallons/person
Watershed, water table, aquifer Flowing artesian well Precipitation Evaporation and transpiration Well requiring a pump Evaporation Confined Recharge Area Runoff Stream Infiltration Water table Lake Infiltration Unconfined aquifer Confined aquifer Less permeable material such as clay Confirming permeable rock layer
Increasing Demand for Water 5,500 5,000 4,500 4,000 3,500 3,000 Water use (cubic kilometers per year) 2,500 2,000 1,500 1,000 500 1900 1920 1940 1960 1980 2000 Total use Agricultural use Industrial use Domestic use Year
Use of Water Resources United States Agriculture 38% Power cooling 38% Industry 11% Public 10% • In U.S., 2000 gallons/day/person • Agriculture - 700 gallons • Industry/commercial - 1200 gallons • Home - 100 gallons - 3 X world average - 20 X developing nations
Problem: Too Little Water Acute shortage Adequate supply Shortage Metropolitan regions with population greater than 1 million • Dry climate • Drought - 40% of people
Problem: Too Much Water • Natural phenomena • Aggravated by human activities • Renew and replenish Reservoir Dam Levee Flood wall Floodplain
Maintaining Adequate Supplies • Increase current supply • Reduce pollution • Use water more efficiently
Tapping Groundwater • Year-round use • No evaporation losses • Often less expensive • Potential Problems!
Problems with Using Groundwater • Water table lowering • Depletion • Subsidence • Saltwater intrusion
Ogallala Aquifer SOUTH DAKOTA WYOMING NEBRASKA Less than 61 meters (200 ft) COLORADO 61-183 meters (200-600 ft) KANSAS More than 183 meters (600 ft) (as much as 370 meters or 1,200 ft. in places) OKLAHOMA NEW MEXICO TEXAS Miles 0 100 0 160 Kilometers
Lowering the Water Table Original water table Initial water table Cone of depression Lowered water table
Groundwater Overuse Groundwater Overdrafts: High Moderate Minor or none
Ground Subsidence Subsidence: High Moderate Minor or none
Saltwater Intrusion Major irrigation well Well contaminated with saltwater Water table Sea Level Salt water Fresh groundwater aquifer Interface Interface Saltwater Intrusion Normal Interface
Using Dams and Reservoirs to Supply More Water Downstream cropland and estuaries are deprived of nutrient-rich silt Flooded land destroys forests or cropland and displaces people Large losses of water through evaporation Downstream flooding is reduced Reservoir is useful for recreation and fishing Provides water for year-round irrigation of cropland Can produce cheap electricity (hydropower) Migration and spawning of some fish are disrupted
Transferring Water from One Place to Another CALIFORNIA NEVADA UTAH Shasta Lake Sacramento River Sacramento North Bay Aqueduct San Francisco Fresno South Bay Aqueduct Colorado River Los Angeles Aqueduct ARIZONA California Aqueduct Central Arizona Project Los Angeles Phoenix San Diego Colorado River Aqueduct Tucson MEXICO • Watershed transfer • California Water Project • Central Arizona Project
Converting Salt Water to Fresh Water and Making it Rain • Distillation desalination • Reverse osmosis desalination • Desalination is very expensive • Cloud seeding
Using Water More Efficiently • Reduce losses due to leakage (e.g., Boston) • Reform water laws (use it or lose it) • Improve irrigation efficiency • Improving manufacturing processes • Water efficient landscaping • Water efficient appliances
Solutions: Achieving a More Sustainable Water Future • Efficient irrigation • Water-saving technologies • Improving water management
Drip or Trickle Irrigation (efficiency 90-95%) Above- or below-ground pipes or tubes deliver water to individual plant roots. Center Pivot (efficiency 80% with low-pressure sprinkler and 90–95% with LEPA sprinkler) Water usually pumped from underground and sprayed from mobile boom with sprinklers. Gravity Flow (efficiency 60% and 80% with surge valves) Water usually comes from an aqueduct system or a nearby river. Irrigation Methods