Download

1 / 93
1.14k likes | 1.78k Views
ECHOCARDIOGRAPHIC ASSESSMENT OF AORTIC VALVE STENOSIS. Dr Ranjith MP. Normal Aortic valve. Three cusps, crescent shaped 3 commissures 3 sinuses supported by fibrous annulus 3.0 to 4.0 cm 2 Node of Arantius. 2D Echo-Long axis view. Diastole. Systole.

E N D
ECHOCARDIOGRAPHIC ASSESSMENT OF AORTIC VALVE STENOSIS Dr Ranjith MP
Normal Aortic valve • Three cusps, crescent shaped 3 commissures 3 sinuses supported by fibrous annulus • 3.0 to 4.0 cm2 • Node of Arantius
2D Echo-Long axis view Diastole Systole
2D Echo-Short axis view Diastole Systole Y or inverted Mercedes-Benz sign
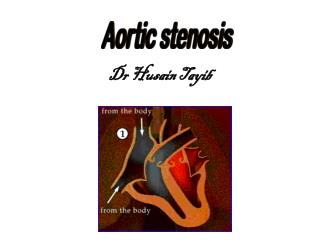
Aortic stenosis- Causes • Most common :- • Bicuspid aortic valve with calcification • Senile or Degenerative calcific AS • Rheumatic AS • Less common:- • Congenital • Type 2 Hyperlipoproteinemia • Onchronosis
Anatomic evaluation • Combination of short and long axis images to identify • Number of leaflets • Describe leaf mobility, thickness, calcification • Combination of imaging and doppler allows the determination of the level of obstruction; subvalvular, valvular, or supravalvular. • Transesophageal echocardiography may be helpful when image quality is suboptimal.
Calcific Aortic Stenosis • Nodular calcific masses on aortic side of cusps • No commissural fusion • Free edges of cusps are not involved • stellate-shaped systolic orifice
Calcific Aortic Stenosis • Parasternal long axis view showing echogenic and immobile aortic valve
Calcific Aortic Stenosis • Parasternal short-axis view showing calcified aortic valve leaflets. Immobility of the cusps results in only a slit like aortic valve orifice in systole
Bicuspid Aortic valve • Fusion of the right and left coronary cusps (80%) • Fusion of the right and non-coronary cusps(20%) Schaefer BM et al. Am J Cardiol 2007;99:686–90 Schaefer BM et al.Heart 2008;94:1634–1638.
Bicuspid Aortic valve • Two cusps are seen in systole with only two commissures framing an elliptical systolic orifice(the fish mouth appearance). • Diastolic images may mimic a tricuspid valve when a raphe is present.
Bicuspid Aortic valve • Parasternal long-axis echocardiogram may show • an asymmetric closure line • systolic doming • diastolic prolapse of the cusps • In children, valve may be stenotic without extensive calcification. • In adults, stenosis typically is due to calcific changes, which often obscures the number of cusps, making determination of bicuspid vs. tricuspid valve difficult
Calcific Aortic Stenosis • Calcification of a bicuspid or tricuspid valve, the severity can be graded semi-quantitatively as 0 1+ 2+ 3+ 4+ Schaefer BM et al.Heart 2008;94:1634–1638. • The degree of valve calcification is a predictor of clinical outcome.Rosenhek R et al. N Engl J Med 2000;343:611–7.
Aortic sclerosis • Thickened calcified cusps with preserved mobility • Typically associated with peak doppler velocity of less than 2.5 m/sec
Rheumatic aortic stenosis • Characterized by • Commissural fusion • Triangular systolic orifice • thickening & calcification • Accompanied by rheumatic mitral valve changes.
Rheumatic aortic stenosis • Parasternal short axis view showing commissural fusion, leaflet thickening and calcification, small triangular systolic orifice
Subvalvular aortic stenosis (1) Thin discrete membrane consisting of endocardial fold and fibrous tissue (2) A fibromuscular ridge (3) Diffuse tunnel-like narrowing of the LVOT (4) accessory or anomalous mitral valve tissue.
Supravalvular Aortic stenosis • Type I - Thick, fibrous ring above the aortic valve with less mobility and has the easily identifiable 'hourglass' appearance of the aorta.
Supravalvular Aortic stenosis • Type II - Thin, discrete fibrous membranelocated above the aortic valve • The membrane usually mobile and may demonstrate doming during systole • Type III- Diffuse narrowing
Doppler assessment of AS • The primary haemodynamic parameters recommended (EAE/ASE Recommendations for Clinical Practice 2008) • Peak transvalvular velocity • Mean transvalvular gradient • Valve area by continuity equation.
Peak transvalvular velocity • Continuous-wave Doppler ultrasound • Multiple acoustic windows • Apical and suprasternal or right parasternal most frequently yield the highest velocity • rarely subcostal or supraclavicular windows may be required • Three or more beats are averaged in sinus rhythm, with irregular rhythms at least 5 consecutive beats
Peak transvalvular velocity • AS jet velocity is defined as the highest velocity signal obtained from any window after a careful examination • Any deviation from a parallel intercept angle results in velocity underestimation • The degree of underestimation is 5% or less if the intercept angle is within 15⁰ of parallel. • ‘Angle correction’ should not be used because it is likely to introduce more error given the unpredictable jet direction.
Peak transvalvular velocity • The velocity scale adjusted so the spectral doppler signal fills on the vertical axis, and with a time scale on the x-axis of 100 mm/s • Wall filters are set at a high level and gain is decreased to optimize identification of the velocity curve. • Grey scale is used • A smooth velocity curve with a dense outer edge and clear maximum velocity should be recorded
Peak transvalvular velocity • The shape of the CW Doppler velocity curve is helpful in distinguishing the level and severity of obstruction. • With severe obstruction, maximum velocity occurs later in systole and the curve is more rounded in shape • With mild obstruction, the peak is in early systole with a triangular shape of the velocity curve
Peak transvalvular velocity • The shape of the CWD velocity curve also can be helpful in determining whether the obstruction is fixed or dynamic • Dynamic sub aortic obstruction shows a characteristic late- peaking velocity curve, often with a concave upward curve in early systole
Mean transvalvular gradient • The difference in pressure between the left ventricle and aorta in systole • Gradients are calculated from velocity information • The relationship between peak and mean gradient depends on the shape of the velocity curve.
Mean transvalvular gradient • Bernoulli equations ΔP =4v² • The maximum gradient is calculated from maximum velocity ΔP max =4v² max • The mean gradient is calculated by averaging the instantaneous gradients over the ejection period
Mean transvalvular gradient • The simplified Bernoulli equation assumes that the proximal velocity can be ignored • When the proximal velocity is over 1.5 m/s or the aortic velocity is ,3.0 m/s, the proximal velocity should be included in the Bernoulli equation ΔP max =4 (v² max- v2proximal)
Sources of error for pressure gradient calculations • Malalignment of jet and ultrasound beam. • Recording of MR jet
Sources of error for pressure gradient calculations • Neglect of an elevated proximal velocity. • Any underestimation of aortic velocity results in an even greater underestimation in gradients, due to the squared relationship between velocity and pressure difference • The accuracy of the Bernoulli equation to quantify AS pressure gradients is well established
Pressure recovery • The conversion of potential energy to kinetic energy across a narrowed valve results in a high velocity and a drop in pressure. • Distal to the orifice, flow decelerates again. Kinetic energy will be reconverted into potential energy with a corresponding increase in pressure, the so-called PR
Pressure recovery • Pressure recovery is greatest in stenosis with gradual distal widening • Aortic stenosis with its abrupt widening from the small orifice to the larger aorta has an unfavorable geometry for pressure recovery PR= 4v²× 2EOA/AoA (1-EOA/AoA)
Comparing pressure gradients calculated fromdoppler velocities to pressures measured at cardiac catheterization.
Comparing pressure gradients calculated fromdoppler velocities to pressures measured at cardiac catheterization. Currie PJ et al. Circulation 1985;71:1162-1169
Aortic valve area Aortic valve area • Continuity equation concept that the stroke volume ejected through the LV outflow tract all passes through the stenotic orifice AVA=CSALVOT×VTILVOT / VTIAV • Calculation of continuity-equation valve area requires three measurements • AS jet velocity by CWD • LVOT diameter for calculation of a circular CSA • LVOT velocity recorded with pulsed Doppler.
Aortic valve areaContinuity equation • LVOT diameter and velocity should be measured at the same distance from the aortic valve. • When the PW sample volume is optimally positioned, the recording shows a smooth velocity curve with a well-defined peak.
Aortic valve areaContinuity equation • The VTI is measured by tracing the dense modal velocity throughout systole • LVOT diameter is measured from the inner edge to inner edge of the septal endocardium, and the anterior mitral leaflet in mid-systole
Aortic valve area-Continuity equationLevel of Evidence • Well validated - clinical & experimental studies. Zoghbi WA et al. Circulation 1986;73:452-9. Oh JK et al. J Am CollCardiol 1988;11:1227-34. • Measures the effective valve area, the weight of the evidence now supports the concept that effective, not anatomic, orifice area is the primary predictor of clinical outcome. Baumgartner et al. J Am Society Echo 2009; 22,1 , 1-23.
Limitations of continuity-equation valve area • Intra- and interobserver variability • AS jet and LVOT velocity 3 to4%. • LVOT diameter 5% to 8%. • When sub aortic flow velocities are abnormal SV calculation at this site are not accurate • Sample volume placement near to septum or anterior mitral leaflet
Limitations of continuity-equation valve area • Observed changes in valve area with changes in flow rate • AS and normal LV function, the effects of flow rate are minimal • This effect may be significant in presence concurrent LV dysfunction.
Left ventricular systolic dysfunction • Low-flow low-gradient AS includes the following conditions: • Effective orifice area < 1.0 Cm2 • LV ejection fraction < 40% • Mean pressure gradient < 30–40 mmHg • Severe AS and severely reduced LVEF represent 5% of AS patients Vahanian A et al. Eur Heart J 2007;28:230–68.
Dobutamine stress Echo • Provides information on the changes in aortic velocity, mean gradient, and valve area as flow rate increases. • Measure of the contractile response to dobutamine • Helpful to differentiate two clinical situations • Severe AS causing LV systolic dysfunction • Moderate AS with another cause of LV dysfunction
Dobutamine stress Echo • A low dose starting at 2.5 or 5 ủg/kg/min with an incremental increase in the infusion every 3–5 min to a maximum dose of 10–20 ủg/kg/min • The infusion should be stopped as soon as • Positive result is obtained • Heart rate begins to rise more than 10–20 bpm over baseline or exceeds 100bpm
Dobutamine stress Echo • Role in decision-making in adults with AS is controversial and the findings recommend as reliable are • Stress findings of severe stenosis AVA<1cm² Jet velocity>4m/s Mean gradient>40mm of Hg Nishimura RA et al. Circulation 2002;106:809-13. • Lack of contractile reserve- Failure of LVEF to ↑ by 20% is a poor prognostic sign Monin JL et al. Circulation 2003;108:319-24..