Download
1 / 53
530 likes | 554 Views
Evaluation and analysis of socioeconomic data collected from censuses. United Nations Statistics Division. Socioeconomic characteristics. Household and family composition Educational characteristics Literacy School attendance Educational attainment Marital status Economic characteristics

E N D
Evaluation and analysisof socioeconomic data collected from censuses United Nations Statistics Division
Socioeconomic characteristics • Household and family composition • Educational characteristics • Literacy • School attendance • Educational attainment • Marital status • Economic characteristics • Economic activity (labor force participation) • Status in employment Core topics from the Principles and Recommendations for Population and Housing Censuses, Rev. 2
Household population • The concept of household is based on the arrangements made by persons, individually or in groups, for providing themselves with food and other essentials for living • A household may be either (a) a one-person household, a person who makes provision for his or her own food and other essentials for living without combining with any other person to form a multi-person household or • a multi-person household, that is to say, a group of two or more persons living together who make common provision for food and other essentials for living • The persons in the group may pool their resources and may have a common budget; they may be related or unrelated persons or constitute a combination of persons both related and unrelated United Nations Workshop on Revision 3 of Principles and Recommendations for Population and Housing Censuses and Evaluation of Census Data, Amman 19 – 23 October 2014
Institutional population • The institutional population comprises persons who are not members of households and living in military installations, correctional and penal institutions, dormitories of schools and universities, religious institutions, hospitals and others • Personnel responsible for the running of an institution and not living in dormitories or similar accommodations should be excluded from the institutional population United Nations Workshop on Revision 3 of Principles and Recommendations for Population and Housing Censuses and Evaluation of Census Data, Amman 19 – 23 October 2014
Household and family composition • The family within the household is defined as those members of the household who are related, to a specified degree, through blood, adoption or marriage • The differences between the household and the family are that: • household may consist of only one person but a family must contain at least two members, • the members of a multi-person household need not be related to each other, while the members of a family must always be related
How to analyze household characteristics • Distribution of the households by size • Average household size • Distribution of households by composition • One-person household • Nuclear household, consisting a single family nucleus, • Extended household, single family nucleus with other related persons, more than one nucleus family, etc. • Composite household, a single family nucleus with other non-related persons, two or more people related to each other but not family nucleus Source: UN Principles and recommendations
How to analyze household characteristics • Nuclear household, defined as a household consisting entirely of a single family nucleus: (i) Married-couple family: a. With child(ren) b. Without child(ren) (ii) Partner in consensual union (cohabiting partner): a. With child(ren) b. Without child(ren) (iii) Father with child(ren) (vi) Mother with child(ren) Source: UN Principles and recommendations
Household composition, Myanmar • Relationship to the head of household • Head • Spouse • Son/daughter • Son-daughter in law • Grandchild/Great grandchild • Parents/parents in law Siblings Grandparent Other relatives Adopted child Non relative United Nations Workshop on Revision 3 of Principles and Recommendations for Population and Housing Censuses and Evaluation of Census Data, Amman 19 – 23 October 2014
United Nations Workshop on Revision 3 of Principles and Recommendations for Population and Housing Censuses and Evaluation of Census Data, Amman 19 – 23 October 2014
Average HH Size, Myanmar Average size 1983 census: 5.2 1997 FRHS:5.0 2001 FRHS:5.2 2007 FRHS: 4.9
Education • Three core concepts; • Literacy – ability to read and write a short, simple statement • School attendance – current, regular attendance at an accredited educational institution or program • Distinguished from enrollment, which means that the student is officially registered at school, not necessarily that s/he actually goes to class • Educational attainment – highest grade completed within the most advanced level reached in the educational system
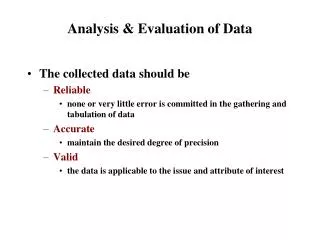
Education • How to evaluate the quality of data: • Cohort analysis • Comparison of education indicators calculated from the census and other sources of data –household surveys, administrative registers
Cohort approach • Use the demographic concept of birth cohort to generate time series data for people who were born in the same year/period by their completed level of education and literacy • Analyze successive census data by cohorts - if they show the same or similar number/percentage for certain level of education while age increases • Assumptions: • Population size changes with births and deaths only – no migration • People do not continue education after reaching certain age - based on educational system in a country
Cohort approach • Data requirement :Consecutive population censuses by age groups, sex and literacy status and completed level of education • Example for two successive censuses conducted in 1994 and 2004
Cohort approach Re- organization of data by birth cohorts
Cohort approach Impact of out-migration among literate population ?
Basic indicators • Adult literacy rate: Percentage of population aged 15 years and over who can both read and write • Literate pop. (15+)/ Total population (15+) • Youth literacy rate: Percentage of persons aged 15-24 years who can both read and write in the population of that age group • Literate pop. (15-24)/ Population aged 15-24 • Age- specific literacy rate • Literate pop at age (X)/ Population at age X Source: Education Indicators Technical Guidelines, UNESCO, 2009
Adult literacy rate United Nations Workshop on Revision 3 of Principles and Recommendations for Population and Housing Censuses and Evaluation of Census Data, Amman 19 – 23 October 2014
Youth literacy rate United Nations Workshop on Revision 3 of Principles and Recommendations for Population and Housing Censuses and Evaluation of Census Data, Amman 19 – 23 October 2014
Cohort approach Educationalattainment, Republic of Korea, 2000, 2005 and 2010 censuses
School attendance • Percentage of children attending school by age • Gross attendance ratio-by level of education • Total attendance in a specific level of education, regardless of age, express as a percentage of the eligible official school-age population corresponding to the same level of education in a given school year • Net attendance rate- by level of education • Attendance of the official age group for a given level of education expressed as a percentage of the corresponding population
United Nations Workshop on Revision 3 of Principles and Recommendations for Population and Housing Censuses and Evaluation of Census Data, Amman 19 – 23 October 2014
Gross attendance ratio : Gross attendance ratio at level of education h in the year t : Students at the level of education h in the year t : Population in age group a which officially corresponds to the level of education h in year t
Net attendance rate : Net attendance rate at level of education h in the year t : Students of the population of age group a at level of education h in the year t : Population in age group a which officially corresponds to the level of education h in year t
Marital status • Marital status is the personal status of each individual in relation to the marriage laws or customs of the country. The categories of marital status should at least include the following: • Single (never married) • Married • Married but separated-comprise both legally and de facto separated • Widowed and not married • Divorced and not married
Marital status 1994 Population and Housing Census of Tunisia Proportion of widowed men
Comparison with survey data • Very similar patter between the census and DHS • Slight difference in the last age group
Singulate Mean Age at First Marriage (SMAFM) • Technique for estimating the mean age at first marriage when actual dates of marriage are not available • a period measure (uses a synthetic cohort) • Very simple data requirements: • Total number of women by 5-year age groups • Total number of ever-married women by 5-year age groups
SMAFM calculation (1) Source: Wachter, Ken, Essential Demographic Methods, Data from United Nations Demographic Yearbook PEMult
SMAFM calculation (2) United Nations Workshop on Revision 3 of Principles and Recommendations for Population and Housing Censuses and Evaluation of Census Data, Amman 19 – 23 October 2014
SMAM, Myanmar, 1973 -2007 United Nations Workshop on Revision 3 of Principles and Recommendations for Population and Housing Censuses and Evaluation of Census Data, Amman 19 – 23 October 2014
Economic activity • Two concepts of the economically active population can be distinguished: (a) The usually active population, measured in relation to a long reference period such as a year (b) The currently active population (or, equivalently, the labour force), measured in relation to a short reference period such as one week or one day
Economic activity • Current activity status – a person’s relationship to economic activity during a short reference period (typically a week) • Employed – a person who worked a defined, minimum amount of time over the reference period (may be as little as an hour) • Unemployed – a person who did not work the minimum amount of time during the reference period but was willing and able to work and looking for a job • Inactive (out of labor force)– a person who did not work the minimum amount of time during the reference period and did not want to work/was not looking for work • Both the employed and the unemployed are economically active! • Employed + unemployed = labor force
Economic activity • Usual activity status – The usually active population comprises all persons above a specified age whose main activity status, as determined in terms of the total number of weeks or days during a long specified period (such as the preceding 12 months or the preceding calendar year) was employed and/or unemployed • Usually employed population: number of weeks or days employed is more than unemployed • Usually unemployed population: number of weeks or days employed is less than unemployed • Both the employed and the unemployed are economically active!
United Nations Workshop on Revision 3 of Principles and Recommendations for Population and Housing Censuses and Evaluation of Census Data, Amman 19 – 23 October 2014
Economic activity • Difficulties: • What does “work” mean? • Goods and services produced for the market • Goods produced for own-use (replacing need to buy on market) • In practice, this is quite difficult to measure, especially in areas with large agricultural or informal economies • Women’s home-based production in particular is often undercounted in surveys • What does “looking for a job” mean? • E.g. some persons may have registered at a government labor office months ago, but done nothing else. Are they looking for a job?
Available data in the 2014 census • Activity status-Q22 • Employee (Government) • Employee (Private) • Employer • Own account worker • Contributing family worker • Sought work • Did not seek work • Full time student • Household work • Pensioner, retired and elderly person • Disabled • Other United Nations Workshop on Revision 3 of Principles and Recommendations for Population and Housing Censuses and Evaluation of Census Data, Amman 19 – 23 October 2014
Available data in the 2014 census • Population not in labor force • Did not seek work • Full time student • Household work • Pensioner, retired and elderly person • Disabled • Other • Employed • Employee (Government) • Employee (Private) • Employer • Own account worker • Contributing family worker • Unemployed • Sought work United Nations Workshop on Revision 3 of Principles and Recommendations for Population and Housing Censuses and Evaluation of Census Data, Amman 19 – 23 October 2014
Basic indicators • Labor force participation rate • Unemployment rate Source: Decent work indicators, Guidelines for producers and users of statistical and legal framework indicators, ILO Manual, Second version, 2013
Basic indicators • Age-specific labor force participation rate • Age specific unemployment rate
LFPR for working age population (10-64) Male % 63.09 Female % 34.98
Unemployment rate for working age population Male % 2.00 Female % 1.17
Basic indicators • Employment to population ratio • EPR, Myanmar, 1983 Total : % 48.07 Male : % 61.83 Female: % 34.57