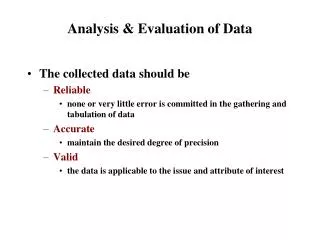
Download

1 / 33
370 likes | 672 Views
BIPLOT ANALYSIS OF AUTOMOBILE EVALUATION DATA. Weikai Yan, Ph. D Email: wyan@ggebiplot.com Web: www.ggebiplot.com. Why biplot?. “One picture is worth of 10,000 words.” Biplot is a very informative “picture” of research data. Three types of biplot will be used in this study.

E N D
BIPLOT ANALYSIS OF AUTOMOBILE EVALUATION DATA Weikai Yan, Ph. D Email: wyan@ggebiplot.com Web: www.ggebiplot.com
Why biplot? • “One picture is worth of 10,000 words.” • Biplot is a very informative “picture” of research data Weikai_Yan2005
Three types of biplot will be used in this study • Automobile by parameter biplot • Genotype by trait biplot in terms of agricultural studies (Yan and Rajcan 2002, Crop Science ) • Automobile by judge biplot • Genotype by environment biplot in terms of agricultural studies (Yan 2001, Agronomy Journal) • parameter by judge biplot • Genetic covariate by environment biplot (Yan and Tinker 2005, Crop Science) Weikai_Yan2005
Car by parameter table Rating for 10 parameters “'Preference Ratings for Automobiles Manufactured in 1980”, obtained from: http://ftp.sas.com/techsup/download/sample/samp_lib/statsampPrincipal_Components_Analysis_of.html Weikai_Yan2005
Car by parameter biplot “Biplot” • PC1 vs. PC2 (“Primary” biplot) • Cars: blue • parameters: red Four questions to ask before trying to interpret a biplot • Mathematical model? • Model =1 (parameter-centered data = GGE biplot) • Goodness of fit? • 64% • S.V.P.? • SVP = 1 ( = 1), car-metric preserving • Axes drawn to scale? • Always “Yes” by GGEbiplot Weikai_Yan2005
Relationships among parameters • Cosine of an angle between two parameters • Correlation between two parameters • Acute angles: Positive correlations • Obtuse angles: Negative correlations • Right angles: no correlation • Vector length • Discriminating ability of the parameter • A short vector: • Not related to any other parameters • Lack of variation or not well represented in the biplot Weikai_Yan2005
Biplot of PC3 vs. PC4 • Display variations that are not displayed by the “primary” biplot of PC1 vs. PC2 • To check if the primary biplot is adequate Weikai_Yan2005
Rank cars based on any parameter“MPG” • High: • Civic_Honda • Chvette_GMC • … • Low • Firebird_GMC Weikai_Yan2005
Rank cars based on any parameter“Ride” • Best: • Continental • Granfury • DL • Poorest • Pinto • Chevette • Mustang Weikai_Yan2005
Rank cars based on any two parameters “MPG” and “RIDE” • Best • DL_Volvo • Poorest • Firebird Weikai_Yan2005
Rank cars on all parameters • Best • DL_Volvo • Poorest • Firebird_GMC The average position of all parameters Weikai_Yan2005
The parameter profile of any car:“Ford Continental” • Best in • Ride • Comfort • Poorest in • MPG Weikai_Yan2005
The parameter profile of any car:“Volvo DL” • Best in • Cargo • Comfort • Reliability • Better than average for everything except “Acceleration” Weikai_Yan2005
Compare any two cars:“Volvo DL” vs. “Continental” • Continental is better in • Ride • Both are similar in • Comfort • Quiet • Accel • DL is better in everything else Equality line Weikai_Yan2005
Which car gets the highest scoresfor what? • Vertices • Continental • DL • Civic • Chevette • Pinto • Firebird Weikai_Yan2005
Which car gets the lowest scoresfor what? • Vertices • Pinto • Firebird • DL Weikai_Yan2005
Car by judge data(personal preference) Preference of 25 judges “'Preference Ratings for Automobiles Manufactured in 1980”, obtained from: http://ftp.sas.com/techsup/download/sample/samp_lib/statsampPrincipal_Components_Analysis_of.html Weikai_Yan2005
Car by judge biplot Weikai_Yan2005
Similarity among judgesin terms of car preferences • Angles • Similarity among judges in preference • Vector length • Discriminativeness of the judges • J8 and J22? Weikai_Yan2005
Biplot of PC3 vs. PC4 • Little variation is left for PC3 and PC4 • The main biplot is adequate Weikai_Yan2005
Similarity among carsfrom the eyes of the judges • Similarity among cars in the eye of the judges Weikai_Yan2005
Genotype evaluation:“who favors what most?” • DL and imported car lovers • 14 judges • Continental and Eldorado lovers • 7 judges • Pinto and Chevette Lover • J24 Why? Weikai_Yan2005
Joint two-way table of “car by parameter” + “car by judge” What are the bases of the preference of the judges? Explanatory variables Response variables Weikai_Yan2005
Response variable by explanatory variable table(correlation coefficients) Weikai_Yan2005
Parameter by judge biplot • The angle between a judge and a parameter: • Positive attitude: acute angles • Negative attitude: obtuse angles • Indifference: a right angle Weikai_Yan2005
parameter by judge biplotWho values what most? • The most important thing for different judges • Braking • “J24” • MPG • 6 • Reliability • 8 • Quietness • 6 • Ride • 4 Weikai_Yan2005
A rotating 3D-biplot In case the primary biplot is not adequate… Weikai_Yan2005
(Gabriel, 1971) “Any two-way table can be analyzed using a 2D-biplot as soon as it can be sufficiently approximated by a rank-2 matrix.” Or 3D-biplots for rank-3 matrix! Weikai_Yan2005
Limitations ofBiplot Analysis Biplot analysis is a very powerful tool, but…
What can biplots do? • Revealing linear patterns, generating hypotheses • Patterns among rows • Patterns among columns • Interactions between rows and columns Weikai_Yan2005
What biplots cannot do? • Revealing non-linear relationships among variables • Hypothesis test (Hypothesis test is NOT always necessary) Weikai_Yan2005
Biplot Analysis & Statistical test are complementary Decisions Hypothesis Testing Biplot Analysis Statistical Tests Pattern discovery Hypothesis generating Data inspection & visualization Research data Weikai_Yan2005
Conclusions • Biplot analysis has evolved into an elegant, powerful, generic tool for research data exploration • Using user-friendly software GGEbiplot, biplot analysis is easy and fun. GGEbiplot beta is freely available at www.ggebiplot.com. Visit www.ggebiplot.com for more about biplot analysis. • Don’t be discouraged by the math; you don’t have to know how a car is made to drive it Weikai_Yan2005