Download
1 / 44
440 likes | 552 Views
The State of the Church in Idaho 1990-2000. Dave Olson www.TheAmericanChurch.org.

E N D
The State of the Churchin Idaho1990-2000 Dave Olson www.TheAmericanChurch.org © 2004 by David T. Olson Sample - Not for Public Use
This is a Sample PresentationIt’s purpose is to give you an idea of what is happening to the Christian church in Idaho, and what the complete “State of the Church in Idaho” Powerpoint looks like. The goal is to encourage pastors and church lay leaders to view and discuss together the missional challenges in Idaho that the Church faces. The complete Powerpoint is $14.95 and is available for immediate download athttp://www.theamericanchurch.org/state/UID20.htm © 2004 by David T. Olson Sample - Not for Public Use
In 1996, polls taken immediately after the Presidential election revealed that 58% of people claimed they had voted, when in reality only 49% actually did. This is called the Halo Effect. People tend to over-inflate their participation in activities that create acceptability within their social group. For many decades, pollsters such as Gallup and Barna have reported that around 45% of Americans attend church every Sunday. But there is a religious Halo Effect. Actual attendance counts have shown that the percentage of people attending church on any given weekend is much lower than was previously thought. © 2004 by David T. Olson Sample - Not for Public Use
The Intent of this presentation is to answer and then expand on two key questions: “How Many People Really Attend Church in Idaho Every Week?” “Is the Christian Church Going Forwards or Backwards in Influence in Idaho?” As the data is analyzed county by county assessing a number of factors, a comprehensive picture of the State of the Church in Idaho will begin to take shape. © 2004 by David T. Olson Sample - Not for Public Use
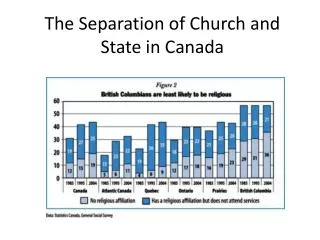
This study uses weekend church attendance as a more reliable and more immediate snapshot of Christian influence than membership. The following map shows the percentage of the population attending a Christian church on any given weekend in all 50 states in 2000. Idaho has an attendance percentage (11.4%) that is much lower than the average for the nation (18.7%), one of the lowest in the nation. © 2004 by David T. Olson Sample - Not for Public Use
The Next Map shows the percentage of the population attending a Christian church on any given weekend in 2000 for each county in Idaho. © 2004 by David T. Olson Sample - Not for Public Use
15.8% Boundary 9.5% Bonner 11.3% Kootenai 13.2% Shoshone 14.9% Benewah 10.4% Latah 12.8% Clearwater 16.6% 28.7% Nez Perce Lewis 20.2% Idaho Idaho Counties 2000 Percentage of Population at Worship in All Christian Churches on a Given Sunday Blue = Lowest Rose = Middle Beige = Highest 13.2% 11.7% Lemhi Adams 13.0% Valley 17.3% Washington 1.8% 2.9% 1.6% Fremont Clark Custer 15.7% 12.9% 1.2% Gem Payette 1.2% Boise 0.3% 1.7% 1.3% Jefferson Madison Butte Teton 12.7% 0.4% Canyon 13.6% 8.5% Camas 6.7% Ada Elmore 5.8% 4.4% Bonneville Blaine Bingham 8.3% 11.5% 14.0% Lincoln Gooding Minidoka 8.9% 6.0% 10.9% 5.7% Power Caribou Jerome 6.3% Bannock 16.4% Owyhee 6.3% Twin Falls 0.9% 0.9% 5.4% Cassia Bear Lake Oneida Franklin 0.0% to 6.0% 6.0% to 12.9% 12.9% to 29.7%
The Next 2 Maps show the population numbers for each county in Idaho. The first map shows the population of each county. The second map shows the growth or decline in population for each county from 1990 - 2000. © 2004 by David T. Olson Sample - Not for Public Use
9,871 Boundary 36,835 Bonner 108,685 Kootenai 13,771 Shoshone 9,171 Benewah 34,935 Latah 8,930 Clearwater 37,410 3,747 Nez Perce Lewis 15,511 Idaho Idaho Counties 2000 Population by County 7,806 3,476 Lemhi Adams 7,651 Valley 9,977 Washington 11,819 1,022 4,342 Fremont 15,181 Clark Custer Gem 20,578 6,670 Payette 19,155 Boise 27,467 2,899 5,999 Jefferson Madison Butte Teton 131,441 991 Canyon 300,904 29,130 Camas 82,522 Ada Elmore 18,991 41,735 Bonneville Blaine Bingham 4,044 14,155 20,174 10,644 Lincoln Gooding Minidoka 7,538 7,304 Owyhee 18,342 75,565 Power Caribou Jerome Bannock 64,284 21,416 Twin Falls 6,411 4,125 11,329 Cassia Bear Lake Oneida Franklin 0 to 8,930 8,930 to 20,578 20,578 to 300,905
Complete Presentation hasMap of 2000 Population Growth for Each County
The Next 2 Slides show the ethnicity of Idaho in 1990 and 2000. The third slide shows the growth or decline in the percentage of the population for each ethnic group. © 2004 by David T. Olson Sample - Not for Public Use
The Next Graph shows the attendance numbers for the churches in Idaho in 1990 and 2000. Evangelicals have grown significantly in attendance, nearly keeping up with population growth. Catholics have also increased and the Mainline has stayed the same. Unfortunately, while overall worship attendance has increased, population has grown at a faster rate. A more reliable standard for evaluating increasing or declining influence is the percentage of the population attending church on any given weekend, shown in the second graph. © 2004 by David T. Olson Sample - Not for Public Use
Complete Presentation hasGraph of 1990 & 2000 Worship Percentage by Category
The Next Graph is a Pie graph visualizing the percentage of the population at churches in each category in 2000. The “Absent” category indicates the percentage of the population that is not worshipping at a Christian church on any given weekend. The second graph shows the percentage gain or decline for each category in Idaho in 1990 and 2000. © 2004 by David T. Olson Sample - Not for Public Use
The 2 Next Charts show the relative strength of the 8 major denominational groups in Idaho. The Pie Chart shows the variety of denominational strength in Idaho. The second chart shows that all groups have declined with the exception of the Pentecostals. © 2004 by David T. Olson Sample - Not for Public Use
Complete Presentation hasPie Chart of 2000 Attendance by Denominational Families
Complete Presentation hasBar Graph of 1990 & 2000 Attendance by Denominational Families
The Next Chart shows the 1990 & 2000 average church attendance by group for both this state and the nation. The second chart shows the 1990 & 2000 population per church for this state and the nation. Among states in 2000, Arkansas has the lowest population per church with 411 people per church, Utah is the highest at 4,586 people per church. © 2004 by David T. Olson Sample - Not for Public Use
Complete Presentation hasBar Graph of 1990 & 2000 Population per Church for State and Nation
The Next 3 Maps show the attendance percentages for the Evangelical, Catholic and Mainline churches in each county in Idaho in 2000. © 2004 by David T. Olson Sample - Not for Public Use
Complete Presentation hasState Map of 2000 Evangelical Attendance Percentage for each County
Complete Presentation hasState Map of 2000 Mainline Attendance Percentage for each County
2.1% Boundary 2.2% Bonner 2.5% Kootenai 2.8% Shoshone 5.7% Benewah 3.4% Latah 2.2% Clearwater 4.6% 3.6% Lewis Nez Perce 10.5% Idaho Idaho Counties 2000 Percentage of Population at Worship in Catholic Churches on any Given Sunday Blue = Lowest Rose = Middle Beige = Highest 2.4% 1.8% Lemhi Adams 2.8% Valley 4.7% Washington 1.5% 0.4% 0.5% Fremont Clark Custer 3.1% 2.9% 0.9% Gem Payette 0.2% Boise 0.2% 0.5% 0.4% Jefferson Madison Butte Teton 2.3% 0.4% Canyon 3.5% 2.2% Camas 2.8% Ada 3.3% Elmore 2.3% Bonneville Blaine Bingham 1.4% 2.4% 4.6% Lincoln Gooding 3.6% Minidoka 2.6% 4.0% 1.8% Caribou Power Jerome 0.0% Bannock 4.4% Owyhee 1.8% Twin Falls 0.3% 0.1% 3.2% Cassia Bear Lake Oneida Franklin 0.0% to 1.8% 1.8% to 3.1% 3.1% to 11.5%
The Next Map shows the growth or decline in the percentage of the population attending a Christian church on any given weekend from 1990 to 2000 for each county. 12 counties grew in attendance percentage, while 32 counties declined. © 2004 by David T. Olson Sample - Not for Public Use
Complete Presentation hasState Map of 1990 - 2000 Christian Church Attendance Percentage Increase or Declinefor each County
The Next 3 Maps show the growth or decline of attendance percentages for the Evangelical, Catholic and Mainline churches in each county in Idaho between 1990 and 2000. For evangelicals, 17 counties grew in attendance percentage, while 21 counties declined. For mainline churches, 5 counties grew in attendance percentage, while 37 counties declined. For Catholics, 14 counties grew in attendance percentage, while 29 counties declined. © 2004 by David T. Olson Sample - Not for Public Use
Complete Presentation hasState Map of 1990 - 2000 Evangelical Attendance Percentage Increase or Declinefor each County
Complete Presentation hasState Map of 1990 - 2000 Mainline Attendance Percentage Increase or Declinefor each County
-30.5% Boundary -16.5% Bonner -22.1% Kootenai -29.7% Shoshone 24.5% Benewah -9.2% Latah -8.9% Clearwater -29.8% -61.8% Nez Perce Lewis 2.8% Idaho Idaho Counties 1990 - 2000 Growth or Decline in Percentage of the Population at Worship in Mainline Churches on any Given Sunday Blue = Decline Rose = Growth -10.7% -6.4% Lemhi Adams -17.8% Valley 18.5% Washington 35.4% 233.2% Fremont Clark Custer 17.3% -34.0% -55.2% Gem Payette -16.9% Boise 231.8% -25.8% 60.5% Jefferson Madison Butte Teton -18.7% -58.9% Canyon -11.2% -50.0% Camas -12.6% Ada Elmore -15.1% 44.1% Bonneville Blaine Bingham -34.3% 16.8% 120.2% Lincoln Gooding Minidoka -6.0% -38.9% 7.5% -32.5% Power Caribou Jerome -100.0% Bannock 35.2% Owyhee -47.5% Twin Falls -50.8% -40.7% 417.6% Cassia Bear Lake Oneida Franklin Decline Growth No data
The Final Chart shows the net gain in the number of churches in Idaho in the past decade. There was a net gain of 33 churches. However, 288 churches were needed to keep up with population growth from 1990 - 2000. © 2004 by David T. Olson Sample - Not for Public Use
The State of the Church in Idaho . . . • Because of the relatively low percentage of church attendance in Idaho and recent growth in attendance in both Evangelical and Catholic churches, the church has both great opportunities and great challenges. • Church attendance has grown for Evangelicals and Catholics. The Evangelical church has grown most significantly, having grown 28% over the last 10 years (the Catholic church has grown by 16%). However, because of population growth, the percentage of the population attending church has been declining across the board. This resulted in a 8.1% loss in the state-wide percentage of the population that attended church between 1990 and 2000. • A major factor in the overall decline is the insufficient net gain in the number of churches in Idaho. Two hundred and fifty-five additional churches needed to have been started in the previous decade to compensate for the decline in percentage attendance. © 2004 by David T. Olson Sample - Not for Public Use
For More Information . . . • Please go to www.theamericanchurch.org for additional information on the American Church. • 12 Surprising Facts about the American Church is available athttp://www.theamericanchurch.org/12supm.htm • The complete Idaho Powerpoint presentation is available athttp://www.theamericanchurch.org/state/UID20.htm • The Complete Boise Powerpoint presentation is available at http://www.theamericanchurch.org/metro/Boise.htm • A Combo Pack (12 Surprising Facts, Idaho and Boise Powerpoints) is available at http://www.theamericanchurch.org/combo/ID0.htm © 2004 by David T. Olson Sample - Not for Public Use
Information on the Information • The spiritual health of churches is multifaceted, and is obviously much more complex than an attendance trend can portray. However, following the example of St. Luke in the Book of Acts, who used the number of people who showed up at various events as a sign documenting the health and growth of the early church, I would suggest that attendance is the single most helpful indicator of health, growth and decline. • Information has been compiled only for orthodox Christian groups – Protestant, Catholic and Orthodox. The Mormons, Jehovah Witnesses, Unitarian-Universalists and the International Churches of Christ have not been included. In addition, information about non-Christian groups has not been compiled. • African American denominations publish very little that is statistical – often not even a list of current churches. This study used data from the 1990 Glenmary study on Black Baptist estimates and AME Zion churches, the average African American worship attendance (from the Barna Research Group), and a statistical model based on the population of African Americans in each county in 1990 and 2000. These were combined to come up with as accurate an estimate as possible. • Independent church data is almost impossible to obtain. (There are actually fewer totally independent churches than is assumed. Most are part of some voluntary association, which typically keeps some records.) Data from the 1990 & 2000 Glenmary study on larger Independent churches (limited to over 300 in attendance) was used along with a statistical model to estimate the attendance at smaller independent churches. • In Catholic churches, the definition of what constitutes membership varies with diocese and church, making numbers sometimes inconsistent from state to state and county to county. In addition to actual mass counts from 1/3rd of Catholic parishes, membership information has been merged with attendance patterns from similar dioceses based on the size of the diocese and the region in which it is located. • Orthodox Churches are included in Totals, but not included as a separate group because of smallness of size nationwide. Division into Evangelical and Mainline categories is based on the division by the Glenmary Study. • This study only looks at how many people attend a Christian church on any given Sunday. The term ‘regular attender’ can be designated to mean someone who attends a Christian church on a consistent basis. Using a simple definition for ‘regular attender’ (attends at least 3 out of every 8 Sundays), between 23% and 25% of Americans would fit this category. Adding ‘regular attenders’ of non-orthodox christian churches and other religions to the totals would increase the percentage to 26% – 28%. © 2004 by David T. Olson Sample - Not for Public Use
This Presentation is based on a nationwide study of American church attendance, as reported by churches and denominations. The database currently has average worship attendances for each of the last 10 years for over 170,000 individual churches. It also uses supplementary information (actual membership numbers correlated with accurate membership to attendance ratios) to project the attendances of all other denominational and independent churches. All told, accurate information is provided for all 300,000 orthodox Christian churches.1 1 This presentation looks only at people attending orthodox Christian churches. Approximately 3 million people attend non-orthodox Christian churches, and perhaps 3 million attend a religious service of another religion. Those ‘houses of worship’ would add another 35,000 churches in the United States and increase the 2000 percentage to 20.5%. © 2004 by David T. Olson Sample - Not for Public Use
For More Information . . . • Presentations such as this are available for the largest 100 metropolitan areas, for each state and for the nation as a whole, as well as other presentations to show what is happening in the American church. Presentations are available either by direct download, CD or print. Please go to www.theamericanchurch.org for ordering information. • To Contact Dave Olson, please email him at DaveTOlson@aol.com. © 2004 by David T. Olson Sample - Not for Public Use