Download
1 / 31
310 likes | 427 Views
The Effect of Dopants on TiO 2 Solar Cell Efficiency Mini Project Presentation FS09. E. Buitrago Advisors: Dr. A. Teleki and A. Tricoli Particle Technology Laboratory Swiss Federal Institute of Technology (ETHZ). Overview. Introduction Global energy problem Solar Cell possibilities

E N D
The Effect of Dopants on TiO2 Solar Cell EfficiencyMini Project Presentation FS09 E. Buitrago Advisors: Dr. A. Teleki and A. Tricoli Particle Technology Laboratory Swiss Federal Institute of Technology (ETHZ)
Overview • Introduction • Global energy problem • Solar Cell possibilities • Dye Sensitized Solar Cells • Narrowing the TiO2 bandgap: doping • Experimental • FSP particle synthesis • Photocatalytic Experiments • Bandgap Calculations • Results • Fe • Nb • Ru • Conclusion • Outlook • Future Work
World Energy Use , US, 2006 http://www.flickr.com/photos/33264427@N06/3166865015/
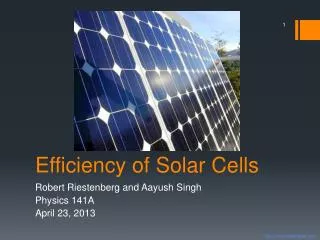
Solar Cell Possibilities $$$$$$ $$ http://en.wikipedia.org/wiki/File:PVeff(rev110707)d.png
I- / I-3 Dye Sensitized Solar Cell (DSSC) Schematic Anode (-) 2 Cathode (+) 1 Wide bandgap semiconductor Eg = 3.2 eV ~ 385 nm (4) Visible light: 400-700 nm 1.8- 3.1 eV 3 A.R. U. Absorbance • Ru2+ → Ru3+ + e− • Anode (oxi): 3I−→I−3+2e− • Cathode (red): I−3+2e−→3I− 1. O’Regan et al. Nature . 1991. 2. Nazeeruddinet al. J.Am.Chem.Soc. 2001. 3. http://bouman.chem.georgetown.edu/S02/lect23/Solar_Spectrum.png\ 4. Grätzel et al. MRS Bulletin. 2005. 5
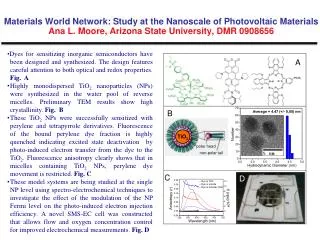
Maximizing Visible Light Absorption: Dopants • 1. Grätzel et al. MRS Bulletin. 2005. • 2.Teoh et al. Catalysis Today. 2007 • 3. Khan et al. Appl. Surf. Sci. 2009 • 4. Salvador et al. Solar Energy Materials. 1980 0.03, 0.3, 1 mol% dopant
FSP Particle Synthesis • TiO2: • 0.5 M TTIP in Xylene/Acetronile(3:1) • Dopant Precursors : • Fe: Iron Acetylacetonate • Nb: Niobium 2-Ethylhexaonate • Ru: Ruthenium (III) Acetylacetonate • 5/5 Flame d Mädler et al. J. Aerosol Sci. 2002
Bandgap Calculations UV-vis Spectrometry Indirect Semiconductor hvα = const (hv-Eg)2 hv = energy of incident photon [eV] α = absorption coefficient [cm-1] α = A/l A = Absorbance (measured with UV-vis) l = cuvette length Singh et al. International Journal of Hydrogen Energy. 2008.
Fe-TiO2 Bandgap and Rutile % 0.03 mol% Fe 0.3 1 Teoh et al. Catalysis Today. 2007.
Photocatalytic Experiments with UV-Light 10 ppm Methylene Blue 8 W UV –lamp 366 nm Catalyst loading: 0.3 kg/m3 UV –Vis 665 nm http://en.wikipedia.org/wiki/Methylene_blue Height et al. Applied Catalysis B. 2005.
UV-Photocatalytic Testing Fe-TiO2 -0.5 kg(catalyst)/m3 -Hydrothermal doping -366 nm -100 ppm MB
Nb-TiO2 Bandgap and Rutile % Nb2O5 Eg = 3.4 eV 0.03 mol% Nb 0.3 1 Teleki et al. Sensor. Actuator. B.2007 Salvador et al. Solar Energy Materials. 1980.
Ru-TiO2 Bandgap and Rutile % Ru02Eg = 2.4 eV 0.03 mol% Ru 0.3 1 Gujar et al. Electrochemistry Communications. 2007.
Conclusion • TiO2 Bandgap reduced by FSP with Nb and Fe. • Highest bandgap reduction Fe- 1 mol%. • Highest photocatalytic activity under UV light for Nb-TiO2 at 0.3 mol% by (2.95 eV).
Outlook • Investigation of photocatalytic activity under visible light for Fe. = 5 mol% -1 kg(catalyst)/m3 -FSP -λ > 400 nm -10 oxalic acid Teoh et al. Catalysis Today. 2007.
Future Work • Synthesis of DSSC with best catalyst.
Appendix • Bandgap Calculations • Photocatalytic Process
Photocatalytic Process • Photo-generation of electron/hole pair • Formation of radicals (Ox) • Radical oxidation of organic compound Kim et al. Catalysis Letters. 2007
Fe-TiO2 Fe3+ionicradius: 0.55 Å Ti4+ionicradius is: 0.67 Å Wikipedia Anatase Rutile 0.03 mol% Fe 0.3 1
Nb-TiO2 Nb5+ ionic radius: 0.64 Å Ti4+ionic radius is: 0.68 Å Wikipedia Anatase Rutile 0.03 mol% Nb 0.3 1
Ru-TiO2 Fe3+ionicradius: 0.57.5 Å Ti4+ionicradius is: 0.67 Å Wikipedia Anatase Rutile 0.03 mol% Ru 0.3 1
Photocatalytic Testing with MB 0.004 mol% 0.04 mol% = 5 mol% -1 kg(catalyst)/m3 -Impregnation method n: Fe(NO3)3•9H2O a: Iron acetylacetonate complex -λ > 400 nm -5 ppm oxalic acid -0.5 kg(catalyst)/m3 -Hydrothermal doping -366 nm -100 ppm MB -0.5 kg(catalyst)/m3 -Impregnation method n: Fe(NO3)3•9H2O a: Iron acetylacetonate complex -300-400 nm -5 ppm oxalic acid -1 kg(catalyst)/m3 -FSP -λ > 400 nm -10 oxalic acid Teoh et al. Catalysis Today. 2007. Li et al. J. Hazardous Materias. 2008 Navío et al. Journal of Molecular Catalysis A. 1996.
Bandgap Calculations Indirect Semiconductor hvα = const (hv-Eg)2 hv = energy of incident photon [eV] α = absorption coefficient [cm-1] α = A/l A = Absorbance (measured with UV-vis) l = cuvette length
Energy TiO2 Bond Orbitals Conduction Band Ti d + (O2p) Ti d Eg = 3.2 eV O2p O2P + ( Ti d) Valence Band