Download
1 / 36
360 likes | 416 Views
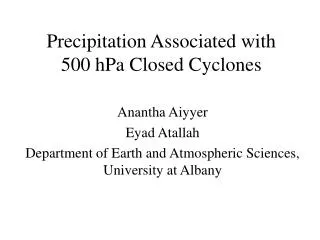
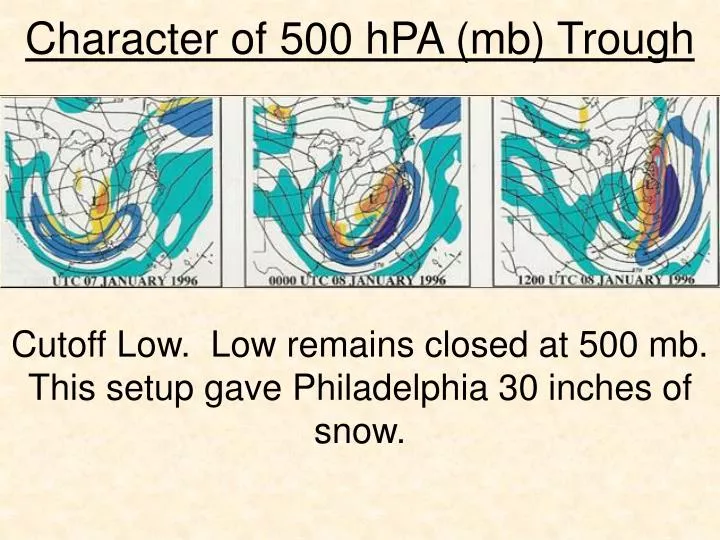
Character of 500 hPA (mb) Trough. Cutoff Low. Low remains closed at 500 mb. This setup gave Philadelphia 30 inches of snow. Character of 500 hPA (mb) Trough.

E N D
Character of 500 hPA (mb) Trough Cutoff Low. Low remains closed at 500 mb. This setup gave Philadelphia 30 inches of snow.
Character of 500 hPA (mb) Trough Open wave that evolves into a closed wave at 500 mb. This setup gave Philadelphia over 12 inches and areas to the north and west over 30 inches.
Character of 500 hPA (mb) Trough Open wave that remains open at 500 mb. This setup gave Philadelphia over 20 inches of snow.
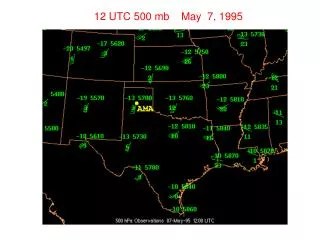
February 7, 1967 (00Z) One of the few positively tilted 500mb troughs that resulted in a heavy snow event for Philadelphia, PA. 70% of the metropolitan area had 10 + inch coverage. The area mean was 10.7 inches.
Positive Tilt Systems “Models tend to overforecast in positive tilt systems. I know this can be dangerous to say with a gulf influence low, so maybe in this instance there is no upward 'surprise' to the expected qpf.” -Rainshadow-
February 7, 1967 (00Z) “But this is the first time I am fired up for something that can really crank someone. The reason: the northern jet is aimed right to where this should come out toward. Problem is when is it coming out. It has two chances to go wild, the first I thought was for later Tuesday and Wednesday. While I still can see that, I see no model support anywhere for the faster kick out and the EPO is up near neutral again for a couple of days, so staying back is an option. - JB January 2007) -
February 7, 1967 (00Z) The second is for late in the week. If one looks at maps of a lot of the east coast major storms, the money in the bank southern branch is always something to be concerned . The strangest one was the Feb 67 storm where it only fed pieces out and the trof was positively tilted ( See mssr Kocins book, always want to put in a plug for Paul) In any case when you believe something is going to happen ( ie winters return) you are naturally going to try to look for it.” - JB January 2007) -
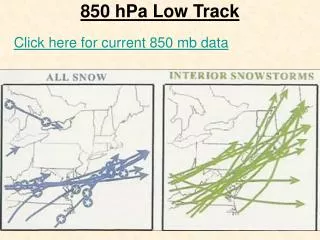
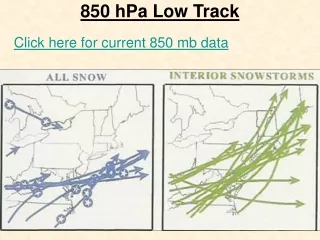
Character of 500 hPA (mb) Trough In addition to there being a trough in the first place, the trough must exhibit specific properties to be conducive for heavy snow fall in the Philadelphia region. The 500mb vorticity maxima needs to be south of Philadelphia and propagate in a northeastward direction near to the East coast. If the vorticity maxima propagates northeastward too far west and away from the coast, it is likely that the precipitation associated with the storm will NOT remain all snow or even mostly snow. Click here for current 500mb chart (Chart 1) Click here for current 500mb chart (Chart 2)
Character of 500 hPA (mb) Trough and Track of 850mb Low In this sort of pattern our you can not have a - NAO ... and in fact it when the NAO is strongly positive.. the overall best pattern you can probably get for snow events on East Coast is to have the trough access developing neutral tilt after costs as the Mississippi River or both time and reaches Appalachian Mountains. You do not want to see the trough access development negative tilt in this pattern in a matter how cold the air mass is over the Eastern have to the US. Without any high latitude blocking and negatively tilt the trough axis will force the system to track in .... and as it develops rapidly...warm air will surge into the coastal plain.-DT on January 11, 2007-
Character of 500 hPA (mb) Trough and Track of 850mb Low Instead what you want to see is either POSITIVELY tilted trough axis when the short wave or longwave trough reaches the Mississippi River OR one that reaches a neutral tilt by the time and reaches the Appalachians. And on top of that you want surface and 850 Low pressure areas to develop fairly far to the south latitude so that there is good overrunning and the Low pressure wave does not become too strong until it was off the coast. -DT on January 11, 2007-
Table V HINTS FOR FORECASTING MODERATE TO HEAVY SNOW (S+) • 4. 500 mb • About 7 degrees latitude downstream of the vorticity max • Slightly left of the track of the closed low/strong vorticity max (approx 2 degrees) • Slightly downstream from where the curvature changes from cyclonic to anticyclonic • When low or trough deepens (look for significant height falls GTE 90m) • When the average lowest 500 mb temperature within distance of 3 degrees latitude of the vorticity max is -30 C • S+ band between -20 C and -25 C (-23 C best) • If storm warms at 500 mb, S+ left of 500 mb low. Otherwise, S+ left of surface low track. • S+ begins at 500 mb ridge line. Ends at either the trough or the inflection point between trough and ridge. • Vicinity of vorticity max path: varies from 60 miles left of vorticity max in open trough or shear zone, to 150 miles left of vorticity max in circulation center or closed low • If surface low is to right of 500 mb height fall center track, S+ will lie parallel and left of height fall track • If surface low is to left of 500 mb height fall center track, S+ parallel and left of either the surface low or 500 mb low track
Table V HINTS FOR FORECASTING MODERATE TO HEAVY SNOW (S+) • 5. 300 mb • S+ along left front exit region and right rear entrance region of jet max • S+ in area between coupled jet • Look for strongest Q-Vector convergence • Typical S+ occurs with deep or deepening long wave
Table V HINTS FOR FORECASTING MODERATE TO HEAVY SNOW (S+) • 6. 200 mb • Look for stratospheric warming on 200 mb chart, as well as on cross section and time section • Heavy snow occurs just to the north of 164 height line
Blizzard of 2006 (Vorticity Maximum) Note the energy transfer. Vorticity maximum (violet) just SE of Philadelphia. Note the light blue shading over Harrisburg, PA and NNE—the best snows are in between the two.
Other Factors: Upper Level Signatures Prior to Heavy Snow Events
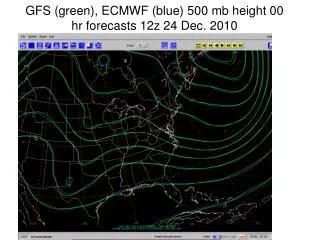
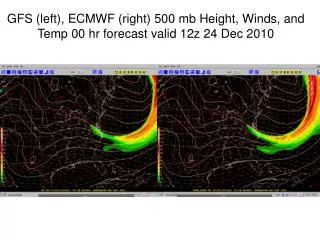
GFS 102 Hour Forecast Made 01/22/07 Valid 01/26/07 “yes we do have a 50-50 low in position. It's not the greatest 50-50 low full-time but it's definitely there. We have a nicely situated PV ... a fairly strong Ridge on the West Coast/ Rockies... and we appear to have phasing occurring between the strong system dropping in on the northern branch and the remains of the system coming out of Southwest. In addition the phasing was occurring over the Mississippi Valley which is ideal and the trough alignment or axis is NEUTRAL....-DT-
GFS 102 Hour Forecast Made 01/22/07 Valid 01/26/07 So what seems to be the problem? And why aren't the other models picking up on the op GFS and GFS ensembles?Well this is one reasons why I am not a big fan of using the operational GFS for forecasting East Coast snowstorms. In the early outlooks ... say Day 7 thru day 10 the model often ends up crushing systems in the STJ/ southern stream which is what the Op GFS and many of the GFS ensembles were doing just a few days ago. Now that we are within the Day 7 time frame the cold bias of the model and the ensembles manifest itself in a different manner.” -DT-
Washington D.C. 8 Inch + Snowfall Composite Pattern becoming more favorable for snow in and around D.C. during late January 2007 –usedtobe-
Washington D.C. 8 Inch + Snowfall Composite Pattern becoming more favorable for snow in and around D.C. during late January 2007 –usedtobe-
RDU (Data in Reference to Raleigh/Durham, NC and Their Major Snowstorms) This is the NH 500mb anomalies for the peak days. Notice the placement and strength of the anomalies. There is actually a weak negative anomaly over southern Greenland, which is odd as one would usually assume a Greenland Block was present during significant snowstorms this far south. The three most notable features, other than the negative anomaly over the Tenn valley associated directly with the storms, are…
RDU (Data in Reference to Raleigh/Durham, NC and Their Major Snowstorms) 1.) A strong negative anomaly east of Newfoundland in the famed 50/50 low area. 2.) A strong positive anomaly over eastern Alaska and the NW portion of the NW Territories in Canada and into the Beaufort Sea. 3.) A low anomaly in the western most Aleutian Islands. These are the three features one must look for on average, for a major eastern NC snow event climo wise. -RaleighWx-
RDU (Data in Reference to Raleigh/Durham, NC and Their Major Snowstorms) Some Conclusions for Raleigh: 1. The 500mb pattern most common in these 20 events is one where there is pronounced ridging over and above Alaska and also in western North America leading to cross-polar flow and a +PNA configuration, but unlike Hickory, the -NAO signature is very diffuse and much less than what is shown in the Hickory data. This could indicate the ideal pattern for big RDU snows is a strong +PNA configuration and a transitional NAO pattern where the value is around neutral. 2. The mean 500mb height values were in general were between 5570-5600m just prior to snowfall, during the height of the storm the values were generally 5480-5550m.
RDU (Data in Reference to Raleigh/Durham, NC and Their Major Snowstorms) 3. The mean 1000-500mb thickness values were around 5390-5405m for most of the storm. The mean 1000-850mb thickness values were between 1286-1292m throughout the storm. The mean 850-700mb thickness were around 1533-1536m throughout the storm. 4. The mean track of the surface low as demonstrated above is from the central Gulf, the northern FL peninsula (further south than the Hickory track), and then approximately 100-150 miles off of the southeast coast (further east than Hickory). 5. Most storms that effect eastern NC with heavy snow, will not effect areas north of southeast VA and the lower Delmarva with heavy precip. See RaleighWx Site for Data
500 mb 30 Day Loop 30 Day 500 mb Heights Loop
Jet Streams and Forecasting the February 13-14 Possible MECS -DT-
Jet Streams and Forecasting the February 13-14 Possible MECS -DT-
Jet Streams and Forecasting the February 13-14 Possible MECS -DT-
Jet Streams and Forecasting the February 13-14 Possible MECS
Jet Streams and Forecasting the February 13-14 Possible MECS
Jet Streams and Forecasting the February 13-14 Possible MECS
Jet Streaks (7 pm on Saturday) “Textbook” jet streak setup as described by Kocin and Uccellini. One streak at base of trough, one streak near ridge axis. Closed 500 hPa low in Ohio. Closed low aided in the intensity of phases 2 and 3 of the storm.
500 mb (11 pm on Saturday) • Storm really started cranking at this point. Just what we needed for heavy snow.
500 hPa Closed Low (1 am on Sunday) • Closed low in Ohio. Polar vortex in North Hudson Bay. Prior to the storm the PV was located in southeastern Canada, then it split.
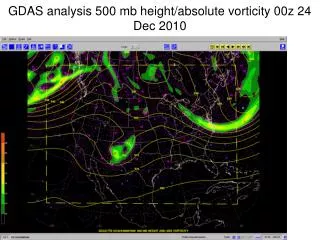
500 mb Absolute Vorticity (7 am on Sunday) 7am on Sunday…look at all that energy focused on one little area. (courtesy of Jeff B.)