Download
1 / 1
10 likes | 76 Views
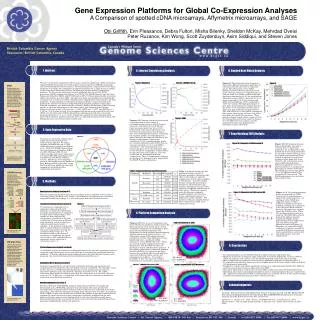
This study compares cDNA microarrays, Affymetrix oligo arrays, and SAGE for global co-expression analysis using Homo sapiens data. Results show limited correlation between platforms.

E N D
CATG CATG CATG CATG CATG CATG CATG SAGE Serial analysis of gene expression (SAGE) is a method of large-scale gene expression analysis.that involves sequencing small segments of expressed transcripts ("SAGE tags") in such a way that the number of times a SAGE tag sequence is observed is directly proportional to the abundance of the transcript from which it is derived. A description of the protocol and other references can be found at www.sagenet.org. AAA AAA AAA AAA AAA AAA AAA AAA AAA AAA AAA AAA AAA …CATGGATCGTATTAATATTCTTAACATG… GATCGTATTA 1843 Eig71Ed TTAAGAATAT 33 CG7224 cDNA Microarrays cDNA Microarrays simultaneously measure expression of large numbers of genes based on hybridization to cDNAs attached to a solid surface. Measures of expression are relative between two conditions. For more information, see www.microarrays.org. AAA AAA AAA AAA AAA AAA AAA AAA AAA AAA AAA AAA AAA AAA AAA AAA AAA AAA AAA AAA Affy Oligo Arrays Affymetrix oligonucleotide arrays make use of tens of thousands of carefully designed oligos to measure the expression level of thousands of genes at once. A single labeled sample is hybridized at a time and an intensity value reported. Values are the based on numerous different probes for each gene or transcript to control for non-specific binding and chip inconsistencies. Gene Expression Platforms for Global Co-Expression Analyses A Comparison of spotted cDNA microarrays, Affymetrix microarrays, and SAGE Obi Griffith, Erin Pleasance, Debra Fulton, Misha Bilenky, Sheldon McKay, Mehrdad Oveisi Peter Ruzanov, Kim Wong, Scott Zuyderduyn, Asim Siddiqui, and Steven Jones 1. Abstract 4. Internal Consistency Analysis 6. Ranked Best Match Analysis Figure 4. cDNA Microarray Figure 3. Affymetrix Figure 9. We have conducted a comparison of three major expression platforms: cDNA microarray, oligonucleotide microarray and serial analysis of gene expression (SAGE) using large sets of available data for Homo sapiens. Several studies have compared two of the three platforms to evaluate the consistency of expression profiles for a single tissue or sample set but none have determined if these translate into reliable global co-expression patterns. To this end we analyzed a recently published data set of 1202 cDNA microarray (cDNA) experiments (Stuart et al. 2003), 242 SAGE libraries from the Gene Expression Omnibus (GEO), and 667 Affymetrix (HG-U133A) oligonucleotide microarray (Affy) experiments also from GEO. All expression data were assigned to LocusLink Ids resulting in an overlap set of 5881 unambiguously mapped genes represented in all three platforms. Using standard co-expression analysis methods, we have assessed each platform for internal consistency and performed all pairwise platform comparisons. Internal consistency was determined by randomly dividing the datasets in half, keeping similar or replicate experiments in the same subset, and comparing the Pearson distances for each subset: Affy gave an r = 0.255, cDNA an r = 0.287, and SAGE an r = 0.150 (p < 0.001) when at least 100 overlapping data points were required for Affy and cDNA, and 10 required for SAGE. All pairwise comparisons found poor correlation between platforms (r < 0.1, p < 0.001). Comparison against the Gene Ontology (GO) showed that all three platforms identify more co-expressed gene pairs with common GO biological process annotations than random data. Figure 9: The ranked best match analysis shows that different expression platforms do sometimes identify the same co-expressed genes. The Affymetrix versus cDNA platforms showed the best agreement with 27.2% of genes having a co-expressed gene of Pearson rank 10 or better confirmed by both platforms compared to 19.5% for random data. Affymetrix versus SAGE agreed for 21.4% of genes compared to 18.3% for random, and cDNA versus SAGE for 19.6% compared to 18.6% for random. The high percentages of gene pairs in agreement for random data are the result of our minimum overlap criteria. Each gene pair must have at least 100 (for Affy, and cDNA) or 10 (for SAGE) overlapping data points. Some genes will have only a few gene pairs that meet this minimum. Thus, having a shared match within a rank of 10 for the two platforms will occur easily by chance. It is the difference from random, not the actual percentage, that demonstrates similarity in genes identified. Figure 5. SAGE Figures 3-5: Internal consistency was found to be dependent on the number of overlapping data points on which Pearson values are calculated. For each dataset, there were gene pairs that were rarely represented on the same experiment and their Pearson correlations were based on very few overlapping data points. Increasing the required number of overlapping data points increases the internal consistency but decreases the number of gene pairs considered. If 100 overlapping data points are required, Affymetrix and cDNA show an internal correlation of ~0.3, and SAGE a correlation ~0.65. Unfortunately, this reduces the data set to only 2655 gene pairs for the SAGE set compared to several million for the other data sets (Table 1). This was insufficient for meaningful platform comparisons. Thus, for subsequent analyses, an overlap of 10 data points was required for the SAGE Pearson calculations. 2. Gene Expression Data 7. Gene Ontology (GO) Analysis Figure 1. Human gene expression data for three major expression platforms (see sidebar) were collected. We used a recently published data set of 1202 cDNA microarray experiments (Stuart et al., 2003), 242 SAGE libraries from the Gene Expression Omnibus (GEO), and 667 Affymetrix HG-U133A oligonucleotide microarray experiments also from GEO (889 experiments were available but only 667 provided p-values). SAGE tags were mapped to genes by the lowest sense tag predicted from Refseq or MGC sequences. Gene Ids from all three platforms were then mapped to LocusLink and the intersection determined. Figure 10. GO analysis for SAGE overlap 10 Figure 10: GO biological process domain knowledge was used to evaluate gene co-expression predictions for each platform. The proportion of gene pairs annotated at a specific common GO term for a given gene were enumerated and compared against the maximum number of gene pairs that share GO terms for a given gene across each neighborhood distance. Affymetrix placed 9-11% (4-7% above random) of its co-expressed gene pairs at common GO terms. The cDNA microarray data placed ~7% (~2% above random) of it’s maximum GO placements. The SAGE performance was no better than random data. Table 1. Summary of Internal consistency results Table 1: Internal consistency was performed using a variety of different methods to determine the effect of (1) similar or replicate experiments; and (2) cancer samples in the dataset. A purely random division of samples was found to produce an unrealistically high internal consistency because of the presence of replicate experiments in each subset. Therefore, samples were divided semi-randomly keeping samples from the same tissue, experimental series, or publication author together. The presence of Cancer samples did not have a significant impact on co-expression results. 3. Methods Figure 11. GO analysis for SAGE overlap 100 Gene Expression Analysis [sections 4-6] Pearson correlations between genes were calculated using a modified version of the C clustering library (De Hoon et al., 2004). Correlations of correlations were calculated using the R statistical package (v. 1.8.1) and plotted with the R hexbin function. Figure 11: If 100 overlapping data points are required for SAGE (instead of 10) its performance against GO visibly improves. An overlap of 10 for SAGE was originally chosen so that a sufficient number of gene pairs would be available for comparison to the Affy and cDNA datasets. However, this may have unfairly biased the SAGE results. When 100 overlapping data points are required, the SAGE data actually showed the highest internal consistency (Figure 5) and performed as well or better than Affy and cDNA in the GO placement analysis (Figure 11). Therefore, we expect the SAGE evaluation to improve as publicly available SAGE data increases to levels comparable to current Affy and cDNA levels (~500-1000 experiments). Figure 2. Internal Consistency Analysis (section 4) To evaluate the consistency of co-expression observed with each platform, we divide the experiments available and determine co-expression for each subset independently. The results are then compared by calculating a correlation of the gene correlations. Division was performed semi-randomly such that similar or replicate experiments remain together. If the platform consistently finds co-expressed genes regardless of the exact experiments involved, the correlation will be close to 1. To determine whether the observed correlation is significant, we repeat the procedure with randomized gene expression values, expecting a correlation close to 0. Set of X expression experiments 5. Platform Comparison Analysis Divide experiments into two groups Randomize gene expression values Set of X/2 expression experiments Set of X/2 expression experiments Figure 6. Affymetrix vs. SAGE Figures 6-8: Poor levels of consistency were observed between platforms. Each point on the plots represents a bin of gene pairs, and its coordinates represent the correlation of those pairs between different datasets. The distribution for each platform appeared nearly random and showed correlations of r < 0.1. Affymetrix versus cDNA showed the best correlation of 0.095, then Affymetrix versus SAGE with 0.041, and finally cDNA microarray versus SAGE with 0.017. There are several possible explanations for this observation: One possibility is that one platform is correct and the others incorrect. A more likely explanation is that each platform identifies different co-expression patterns because the available data for each platform represents different tissue sources and experimental conditions. Yet another possibility is that few genes are actually consistently co-expressed in biological systems. Calculate all pairwise Pearson correlations Calculate all pairwise Pearson correlations Compare Pearson correlations for each gene pair Graph and determine overall correlation 8. Conclusions Platform Comparison Analysis (section 5) A correlation of gene correlations was determined as for the internal consistency analysis, using the entire experiment set for each platform, and comparing correlations between platforms. If the two platforms being compared report the same distance between each gene pair, the overall correlation between platforms should be near 1. > Co-expressed genes can be identified based on large-scale gene expression data > Measures of internal consistency range from 0.255 to 0.942 for Affymetrix, 0.287 to 0.890 for cDNA microarrays and 0.155 to 0.770 for SAGE depending on how the data is divided. > Direct comparison of correlation values between platforms yields poor correlations (R<0.1) > Co-expression identified by larger sets of overlapping data will be most reliable (with more than 100 experiments preferable). > Comparison of gene rank shows significant overlap in co-expressed pairs identified by different platforms, particularly between Affymetrix and cDNA. > Gene pairs identified as coexpressed are more likely to share the same GO biological process. > Affymetrix microarrays consistently identify the most co-expressed genes that are confirmed by GO. SAGE also outperforms cDNA if sufficient data are available but due to the smaller number of SAGE experiments few gene pairs have sufficient overlap. R = 0.041 N = 2,253,313 Ranked Best Match Analysis (section 6) Instead of considering the actual Pearson correlation between each gene pair and comparing between platforms, the correlation rank was considered. For example, it may be that for gene A, SAGE experiments identify its most similar gene (in terms of expression patterns) to be gene B with a Pearson correlation of 0.9. The cDNA microarray data might also identify gene B as the closest gene to A but with a Pearson value of 0.78. In this case, a comparison of Pearson rank is an alternative method for evaluating cross platform consistency. Figure 8. Affymetrix vs. cDNA Microarray Figure 7. cDNA Microarray vs. SAGE Acknowledgments Gene Ontology Analysis (section 7) The Gene Ontology (GO) MySQL database dump (release 200402 of assocdb) was downloaded and a GO MySQL database was constructed. The most specific GO annotations for all genes found in common with our dataset were extracted and written out to files. This totaled 2340 genes including those inferred from electronic annotations (IEAs). PERL scripts were developed to evaluate the number of gene pairs annotated to a common GO term node across a gene’s expression similarity neighborhood for each platform. Similar analyses were implemented to evaluate ranked best match genes between platforms found at common GO terms and to evaluate the cardinalities of these gene pair neighborhoods within each platform. funding | Natural Sciences and Engineering Council of Canada (for OG and EP); Michael Smith Foundation for Health Research (for OG, SJ and EP); CIHR/MSFHR Bioinformatics Training Program (for DF); Killam Trusts (for EP); Genome BC references | 1. Stuart et al. 2003. Science. 302(5643):249-255; 2. De Hoon et al. 2004. Bioinformatics. Feb 10 [epub ahead of print]; 3. Shannon et al. (2003). Genome Res 13:2498-2504. For more information, see www.affymetrix.com. R = 0.017 N = 2,253,313 R = 0.095 N = 2,253,313