Download
1 / 23
240 likes | 361 Views
Latitudinal Dependence of Atlantic Meridional Overturning Circulation (AMOC) Variations. Rong Zhang GFDL/NOAA. 2010 U.S. AMOC Annual Meeting June 7 , 2010. Atlantic Meridional Overturning Circulation (AMOC).

E N D
Latitudinal Dependence of Atlantic Meridional Overturning Circulation (AMOC) Variations Rong Zhang GFDL/NOAA 2010 U.S. AMOC Annual Meeting June 7, 2010
Atlantic Meridional Overturning Circulation (AMOC) • The RAPID program was established since 2004 to monitor AMOC variations at 26.5oN [Cunningham et al. 2007]. However, the latitudinal dependence and propagation of AMOC variations remains unclear. • What is the relationship between subpolar and subtropical AMOC variations? • Do we need to monitor AMOC variations at the subpolar region? • This paper studies the latitudinal dependence and propagation of AMOC variations using a fully coupled climate model (GFDL CM2.1).
Climatological AMOC in GFDL CM2.1 Control Simulation in Depth Space Is the maximum AMOC at 42oN a real thing or just an artifact in depth space?
Climatological AMOC in GFDL CM2.1 Control Simulation in Density Space The maximum AMOC shifts northward to higher latitudes in Density Space.
GFDL CM2.1 Control Simulation First take-home message: The typical estimation of AMOC in depth space is not valid at mid and high latitudes. For studies of subpolar AMOC variations or their meridional connectivity with those in the subtropics, AMOC variations need to be estimated in density space, instead of depth space.
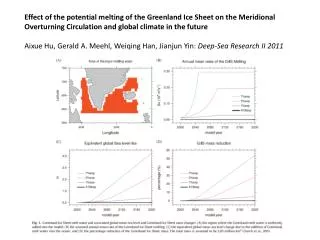
Latitudinal Dependence of AMOC Changes in 21th Century Simulations (GFDL CM2.1) Second take-home message: Over the course of the 21st century, the simulated AMOC weakening is much more severe at high latitudes than that at lower latitudes in density space.
Classic Picture of the Meridional Propagation of AMOC Variations AMOC variations are often thought (Kawase, 1987; Johnson and Marshall, 2002; etc.) to propagate with the Kelvin wave speed, resulting in a short time lead (less than a few months) between AMOC variations at high and low latitudes and the predictability from the short time lead is less useful. (Bryan, 1986) (Johnson and Marshall, 2002)
Bingham et al. 2007 found a very low correlation between simulated subpolar and subtropical AMOC variations in depth space at zero time lag and interpreted it as a low meridional coherence between subpolar and subtropical AMOC variations based on the classic picture of AMOC propagation. Cross correlation between AMOC anomalies in depth space at zero time lag from HadCM3 and OCCAM simulations (Bingham et al. 2007).
Latitudinal Dependence of AMOC Variations in GFDL CM2.1 Control Simulation
The southward propagation of AMOC variations associated with changes in the NADW formation can be classified into three regimes Regime I: advection speed Regime II: Kelvin wave speed Regime III: Rossby wave speed Cross Correlation between the AMOC variation at 49.5oN and AMOC Variations at Various Latitudes (GFDL CM2.1 Control Simulation ).
Mechanism of the Meridional Propagation of AMOC Variations GFDL CM2.1 Control Simulation
Recent RAFOS float observation in the western North Atlantic shows interior pathways of the LSW (Bower et al. 2009) .
Schematic diagram of the propagation a positive AMOC anomaly associated with enhanced NADW formation
Schematic diagram of the propagation a positive AMOC anomaly associated with enhanced NADW formation
Southwestward propagation of the anomalous cyclonic gyre associated with a positive AMOC anomaly GFDL CM2.1 Control Simulation
Modeled SSH PC1, Tsub PC1, AMOC Index from GFDL CM2.1 r(SSH,Tsub) = 0.85 Extra-Tropical Fingerprint of AMOC Variations The leading modes of SSH and subsurface temperature (Tsub) constitute a fingerprint of AMOC variations, and might be used as a AMOC proxy (Zhang 2008).
Cross Correlation between the AMOC Fingerprint (Tsub PC1) and AMOC Variations at Various Latitudes GFDL CM2.1 Control Simulation
Latitudinal Dependence of AMOC Variations in the 20th Century Simulations (GFDL CM2.1)
Summary Using GFDL CM2.1, this study shows that: 1, The estimation of AMOC in depth space is not valid at mid and high latitudes. For studies of subpolar AMOC variations or their meridional connectivity, AMOC variations need to be estimated in density space. 2, Over the 21st century, the simulated AMOC weakening is much more severe at high latitudes than that at lower latitudes in density space. 3, Due to the existence of interior pathways of the export of NADW from Flemish Cap to Cape Hatteras, AMOC variations in this region propagate with the slow advection speed, instead of the fast Kelvin wave speed suggested by previous studies, resulting in a much longer time lead (several years) between subpolar and subtropical AMOC variations. The longer time lead provides a more useful predictability. The results suggest that estimating AMOC variations in density space at higher latitudes might reveal a much stronger signal with a several-year time lead.