Download
1 / 24
240 likes | 339 Views
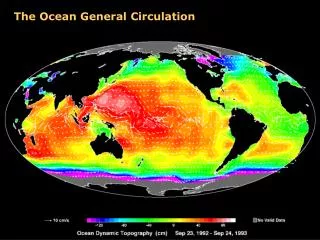
Learn about ocean currents, tracers, water properties, and build your ocean circulation map. Discover how oceanographers track deep temperatures and sinking pathways, and delve into radiocarbon dating in this educational resource.

E N D
Tracing the ocean overturning circulation Science Olympiad Resource Anand Gnanadesikan NOAA Geophysical Fluid Dynamics Lab
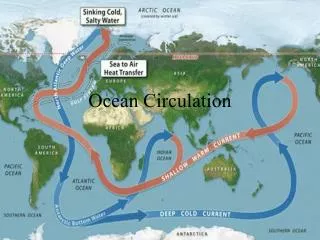
Welcome!- In this lesson you will learn • How we first learned about deep ocean currents. • How modern oceanographers use tracers, properties of ocean water, to track these currents. • Use these tracers to build your own picture of the great ocean conveyor.
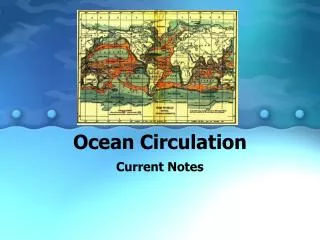
Base map Print out a copy of this slide to build up your own version of the circulation
How to get chilled wine at sea.. In 1751, Captain Henry Ellis made a surprising discovery using a new scientific instrument- the thermometer. Upon the passage, I made several trials with the bucket sea-gage, in latitude 25'-13" north; longitude 25'-12" west. I charged it and let it down to different depths from 360 feet to 5346 feet; when I discovered, by a small thermometer of Fahrenheit's, made by Mr Bird, which went down in it, that cold increased regularly, in proportion to depths, till it descended to 3900 feet: from whence the mercury in the thermometer came up at 53 degrees; and tho' I afterwards sunk it to a depth of 5346 feet, that is a mile and 66 feet, it came up no lower. The warmth of the water upon the surface, and that of the air, was at the time by the thermometer 84 degrees. I doubt not but that the water was a degree or two colder, when it enter'd the bucket, at the greatest depth, but in coming up had acquired some warmth" Capt. Henry Ellis- Report to the Royal Society, 1751 Photo of early water sampler:NOAA Ellis also reported that the cold water enabled him to get cold drinks at sea!
How do we get more data? Research vessels (above) lower CTDs with water sampling rosettes (right) which take samples of water at different depths as well as measuring a high-resolution profile of conductivity and temperature.
What do deep temperatures look like? • The plot at left is a contour plot of temperature in the middle of the Atlantic. The colors show how warm the water is. The horizontal axis shows the latitude and the vertical axis shows depth. • Pick out the temperature at the equator (0 Latitude) and 2000m depth • Answer is between 3 and 4 C! • Try picking a latitude and making a plot of temperature vs. depth.This is the kind of exercise that often appears in my tests. Since it never gets that cold on the equator, it was very quickly realized that this cold water had to come from polar regions.
But where does this water go down?-CFCs • One particular tool that oceanographers use is dissolved substances whose concentration in the atmosphere has changed over time. • The plot at the left shows the concentration of a chlorofluorocarbon, an inert gas that was used in aerosol cans for many years (until it was found that it when it was hit by cosmic rays it broke down and released chlorine that damaged the ozone layer). • In what year is the concentration 50 pptv (parts per trillion by volume)? Answer: ~1965 • In what year is it 200 pptv? • What is the value in 1980? • If you find water with virtually none of this chemical, what does this tell you about when it last touched the atmosphere?
A global survey found the following distribution of this chemical (in about 1995) What does this tell you about where the water in the ocean is sinking to depth? Draw these sinking pathways on your base map in blue.
Answer… • Key features • Sinking in the North Atlantic (formation of North Atlantic Deep Water) • Sinking in the Southern Ocean that is more diluted by the ambient water (Formation of Antarctic Bottom Water). • No deep sinking in the North Pacific.
What you need to know about radiocarbon • Carbon atoms have a nucleus with 6 protons, but they can have 6, 7 or 8 neutrons. • When they have 8 neutrons (the resulting atom is known as carbon-14 or radiocarbon), the resulting configuration is weakly unstable, given enough time one of the neutrons will turn into a proton- emitting an electron and a funny particle known as an antineutrino. • If you start with 256 radiocarbon atoms, after 5730 years only half the radiocarbon atoms will still be carbon, the others will have turned into nitrogen. • Radiocarbon is produced by energetic cosmic rays (and nuclear bombs) in the atmosphere. In the surface ocean it can take about 10 years to come into equilibrium. • Radiocarbon is measured in terms of the fraction of atoms “left over” from the number that would have been in the water if it had been in equilibrium with the atmosphere before the atom bomb tests of the 1950s.
Radiocarbon gives a sense for how slowly the ocean is ventilated 25% of the radiocarbon in the North Pacific has decayed. This implies a ventilation age of ~2000 yr.
Deep Circulation We get this from the fact that the water gets older (lower radiocarbon) as you move into the Atlantic and the Pacific.
Where does the deep water come up? If the surface and deep are exchanging rapidly, we’d expect the radiocarbon at the surface to be closer to that at depth. The plot at left shows the size of the difference. Notice where the smallest differences occur. But are these small differences due to water coming up rapidly or water sinking from the surface rapidly?
Where does the deep water come up? We can get some sense of the answer by comparing the radiocarbon difference with the CFC12 difference. Remember that radiocarbon differences are generated in the deep ocean, while CFC differences are generated at the surface. Notice the difference between the North Atlantic and the Southern Ocean.
Where does the deep water come up? Both tracers low- high mixing Radiocarbon, somewhat low, CFC high, weak upwelling Radiocarbon very low, CFC relatively high, strong upwelling with some mixing. So most of the deep water flowing into the Indian/Pacific comes right back to the Southern Ocean!
Connecting this to the intermediate waters: Salinity • Key points- salinity is a conserved tracer (there are no ocean gnomes sucking the salt out or adding it in the middle of the water column). • So if you have a maximum or minimum of salinity in the ocean interior, it must have gotten transported there from the ocean surface.
Cross-section of salinity shows… Minima and maxima pentrating into ocean interior. Let’s look at the minimum coming out of the south. We can follow the salinity and pCFC concentrations along a density surface that lies just above this minimum.
… which gives the following picture The colors show CFCs, the lines concentrations of salinity. You can see plumes emanating (sometimes in one tracer, sometimes in both) from the Southern Ocean. Add these to your plot in purple.
Your plot should now look something like this. Now we are forming colder,denser waters in the North Atlantic and
Your plot should now look something like this. Now we are forming colder,denser waters in the North Atlantic and turning the dense water back into warmer,lighter intermediate water in the Southern Ocean. How do we get this water back to the North Atlantic?
Indonesian throughflow Direct current and tracer measurements have shown that there is a large flow of water through the Indonesian archipelago. http://www.marine.csiro.au/LeafletsFolder/pdfsheets/64indothroughflow.pdf
Agulhas eddies The plots above show surface speed from a computer model. The model on the left is a low resolution model, the one on the right a much finer-resolution model. You can see red circles that correspond to eddies in this model. These eddies are part of a flow of warm water from the Indian into the Atlantic.
Compare this to a “standard version” You will see this picture in a lot of textbooks and websites. From what we’ve done here, you should now be able to tell what’s wrong with it!