Download
1 / 18
190 likes | 311 Views
Explore the dynamics of the MOC in the Atlantic with observations from RAPID Array and ECCO2 Model. Discover impacts of MOC on heat flux, climate change, and more. Acknowledge contributions from mentors and research organizations.

E N D
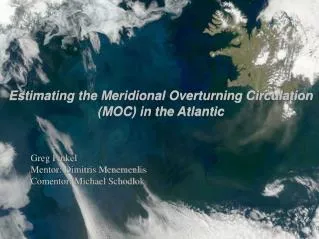
Estimating the Meridional Overturning Circulation (MOC) in the Atlantic Greg Pinkel Mentor: Dimitris Menemenlis Comentor: Michael Schodlok
Outline • MOC: Meridional Overturning Circulation • Observations: RAPID Array • Model: ECCO2 Model • Results: Comparisons
MOC:Meridional Overturning Circulation • North Atlantic MOC: • northward movement of near surface warm waters • southward movement of deeper, colder waters • Warm water emerges from Florida Strait as the Gulf Stream • Water sinks down at higher latitudes • begins to move southward at a depth of 2km
Surface winds and density gradients create northward flow • Warmer, saltier, lighter at low latitudes Colder, fresher, denser water and higher latitudes - Max of 25% of the global heat flux (at 24.5 degrees N) - Northwest parts of Europe to enjoy a mild climate despite the high latitude - 2007: Intergovernmental Panel on Climate Change (IPCC) reported clear evidence that climate change is happening now
Two things can slow this process • Ocean surface warming • Decreased Salinity • Freshwater runoff from melting glaciers and the Greenland Ice Sheet ------> • Controversially suggested that MOC has slowed by 30% since 1957 • 20% decrease in northward heat transport ACIA (Arctic Climate Impact Assessment)
Determining The MOC • Surface: zonal (east-west) stress from winds cause Ekman transport • Perpendicular to the direction of the wind • Usually occurs within the top 50m • Major component of the short-term variability in the MOC • Wind measurements used to calculate the contribution of the Ekman transport to the MOC
Measure the density of the water at different depths • With densities, currents can be estimated at different depths • Ekman transport and density transport gives a rough estimate of the meridional velocity • Density-induced transport (light blue arrows)
RAPID/MOCHA Array • Natural Environment Research Council (NERC) in the UK • Rapid Climate Change/Meridional Overturning Circulation and Heat Flux Array (RAPID/MOCHA) • Deployed in March 2004 to monitor MOC at 26 degrees N • 19 Moorings measure variations in pressure, temperature, and salinity • Determine density at different depths
ECCO2:Estimating the Circulation and Climate of the Ocean, Phase II • High resolution global-ocean and sea-ice data synthesis • ECCO2 is a project from collaboration between JPL, MIT, and SIO (Scripps Institution of Oceanography) • The estimates are derived from a least-squares fit (or regression) of the MIT-gcm model (MIT general circulation model) to observations • Cubed-Sphere model • ¼ degree grid • 50 depth levels • 1 cube per month
Summary/Outlook • Model and In-situ Temperature data agree well for East and West Boundaries • Model and In-situ Salinity data correspond well for Western Boundary • Meridional velocities correlate to depths of ~1000m • Zonal velocities don't agree but have similar trends
Grid spacing, differences in depth spacing, interpolation, and large averages may account for some differences • ECCO2 could be improved by using the RAPID data to further constrain the model
Acknowledgments • Mentor: Dimitris Menemenlis • Comentor: Michael Schodlok • Robin McCandliss (BODC) • The British Oceanographic Data Centre (BODC) • JPL • Caltech