Download
1 / 26
270 likes | 288 Views
Explore Europe and German advancements in wind and solar energy, emphasizing self-sufficiency for electricity production. Discover policy insights, population acceptance, and infrastructure development in renewable energy. Learn about key initiatives and progress indicators shaping the energy landscape.

E N D
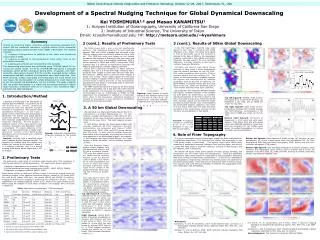
34th USAEE/IAEE North American Conference, Tulsa, Oklahoma/USA 23.-26. October 2016 Wind and Solar – Experiences in Europe and Germany with Selfsufficiency for Electricity Hermann-Josef Wagner Institute for Energy Systems and Energy Economy Ruhr-University Bochum, Germany lee@lee.rub.de
Structure of my presentation • Electricity production – activities in Europe • German energy way – enforcement of wind and sun • Risk and experiences – high acceptance in policy and population • Conclusion
Sweden Finland Great Britain Estonia Latvia Ireland Denmark Lithuania Netherlands Poland Germany Slovakia Czechia Belgium Hungary Austria Romania France Bulgaria Portugal Italy Spain Greece FiT = Feed-in tariffs FiP = Feed-in premium TGCs= Tradablegreencertificates CfD= ContractforDifference Source: 2014 JRC wind statusreport Different conveyingsystemsforelectricity (renewableenergies) in the EU
Worldwide wind use Germany at beginningof 2016 about 46 GW, 42 Onshoreand 4 Offshore. Forcomparison: at the end of 2003: worldabout 40 GW, Germany about 15 GW DEWI Magazin 2015, Global InstalledCapacity & Forecast http://www.dewi.de/dewi_res/index.php?id=23# Erneuerbare Energien - Das Magazin, edition March 2015
Parabolic trough power plant „Arenales“, Spain • Thermal solar power station „Arenales“ (Spain) • 50 MW • 156 rowsofparabolicreflecors, that • areabletofollowthe solar altitude • 510.000 m² reflectorsurface • Moltensaltstorage • The integratedstorageenables an • electricityproductionuptosevenhours • withoutsunshine Source: „Steag speist erstmalig Strom ins Netz“, BWK, Bd. 65 (2013) Nr. 11/12 Image: www.steag.com Image: www.focus.de
Structure of my presentation • Electricity production – activities in Europe • German energy way – enforcement of wind and sun • Risk and experiences – high acceptance in policy and population • Conclusion
Map of Europe – some facts about Germany • About Germany: • Area: 350 000 km2 • 82 Million people • Population density: • 230 cap / km2 • Reunification: 1990 • GDP: 28 000 US $ / cap • Conventional capacity power stations: 84 GW • Wind power stations: 46 GW • Photovoltaic areas: about : 40 GW • Energy policy: Enforcement of renewable, facing out nuclear, facing out German coal mining, reduction of Greenhouse Gases
Rounded values Survey: BMWI Energiedaten 05.04.2016 The policychangesthe mixElectricitygeneration in Germany in 2015 (grossabout 650 TWh)
German Renewable Energy Act (EEG) 2016 (valid from 2017) • Objective of green electricity: • 2025 (2035): 40-45 % (55-60 %) of the electricity consumption should be covered by green energy • Expansion target wind offshore till 2020: 6,5 GW and till 2025: 11 GW • Limiting the expansion of new wind onshore: 2,9 GW/year including replacement of old stations • Limiting the expansion of new biogas plants: 150 MW/year (next 3 years) than 200 MW/year • Limiting the annual expansion of new photovoltaic: 2,5 GW/year • Green electricity marketing: • Direct marketing of all new plants with a power output of 750 kW or more, except biomass 150kW or more • Reducing of financial support: • Degradation of immoderate promotion and bonus, progressively reducing of support • Industrial companies: • Energy-intensive companies have to pay about 15 % of the Renewable Energy Act levy, up to a maximum limit of 4 % of the companies´ gross value added • For large scale consumers, such as aluminum or steel plants, the maximum limit decreases to 0,5 % • Own power consumption: • Existing plants are exempted from the Renewable Energy Act • Electricity, generated by eco-electricity plants, is charged with 40 %, all the rest has to pay the whole amount • Small plants up to 10 kW (e.g. photovoltaic systems on house roofs) are exempted from the Renewable Energy Act levy • Railway: • Payment of 20 % of the Renewable Energy Act levy • Private Consumer: • Payment of 100 % of the Renewable Energy Act levy (about 7,3 €-Ct/kWh = 8,3 US-Ct US Ct/kWh)) Source: - VDI Nachrichten, 4.Juli, 2014, Nr. 27/28 - http://www.bmwi.de/DE/Themen/Energie/Erneuerbare-Energien/eeg-reform.htm -Different internet sources – Status: 5 August 2016l
Offshore wind energy in Germany in 2016 Baltic Sea North Sea Denmarc Ø Poland Germany Netherlands Power of WTG in North and Baltic Sea German territoryandexclusiveeconomiczone Service port Completly in use Componentport Withgridconnection Constructionzone offshore wind energy Partially in use Installedwithoutgridfeed Base port Investment decisionavailable Frontierand 12 milezone In construction In construction Approvedwithinvestmentdecision Source: offshore-stiftung.de/sites/offshorelin.de/files/mediaimages/uebersichtoffshorewindparks
Bubble curtain as underwater noise protection during pile-driving pile sealevel bubblecurtain About 0,2-0,4m3/min/m airvolume Tripod Monopile Ø reducednoiseemission noiseemission nozzlepipe seabed Source: left: Trianel; right: NVB, Nordhäuser Versorgungsbetriebe, entnommen aus: VDI Ingenieurforum, Ausgabe 2/2012
Repair of corrosion protection Photo: Helmut Müller; Sonne, Wind und Wärme 4/2012
Source ofthedata 2014: Bundesnetzagentur/Photovoltaik Source ofthedatauntill 2013: BWK 5/2012 Source ofdata 2015: estimatedvalue, Fraunhofer ISE Source ofdataworldwide 2015: IEA At the end of 2015 in Germany installedcapacity: about 40 GW Worldwide installedcapacity at the end of 2015: 230 GW Photovoltaic
Structure of my presentation • Electricity production – activities in Europe • German energy way – enforcement of wind and sun • Risk and experiences – high acceptance in policy and population • Conclusion
Photovoltaics 19% (Nuclearpower: 0,0%) 2012 2024 Statistical value (175 GW) Objectiveofgovernment (225 GW) (Scenario B) Objectiveforthe power stationcapacities in Germany in theyear 2024
Renewable energy levy for households in Germany (plus 19% tax) In Cent/ kWh Source: 2003-2014 BMU,EEG/KWK-G, Reuters 2015 LEE 2016 BMWI
Windenergy and liberalisation of markets require bulk transmission capacity
Electricity network development plan for the Germany (BBPIG 2015) Bild: http://www.netzausbau.de/SharedDocs/Bilder/DE/Karten/MonitoringGesamt.jpg?__blob=normal
Structure of my presentation • Electricity production – activities in Europe • German energy way – enforcement of wind and sun • Risk and experiences – high acceptance in policy and population • Conclusion
Conclusions • Wind energy and photovoltaic use is increasing worldwide • Technology is available • Off shore wind park's are under construction, they deliver more electricity, but they are expensive • In Europe are different support systems: Feed-in tariff, tax incentives, quota • Germany: Fixed feet-in regulation for electricity of renewables over 20 years, policy is changing, private consumers are paying 7,4 €-Cent/kWh (8,3 US-Cent/kWh) for introduction and operating of renewables, companies less • German government is following an energy concept 2050 • CO2-certificates are increasing electricity price only a little bit, renewable energies much more
Thankyou Bild: http://www.cpmax.com/tl_files/content/leistungen/inspektionen/galerie/100629%20097_klein.jpg
* In reference to 1990, ** In reference to 2008, *** In reference to 2005 German energy-concept
Costs of a 2 MW onshore wind power station Source: Deutsche WindGuard GmbH; Kostensituation der Windenergie an Land in Deutschland, Stand 2013
Average structure of the electricity rate in Germany: Household with a consumption of 4.000 kWh/a Total: 30,2 ct/kWh, ofwhich 50% arefederaldemand For comparison: The electricity price was at the beginning of the year 2010 about 21,3 ct/kWh 4,8 ct/kWh Value-added tax 2,1 ct/kWh Electricity tax (former “green tax”) 1,8 ct/kWh Concession levy for communities 0,2 ct/kWh Act on Combined Heat and Power Generation Energy-price: 21,5 ct/kWh 6,2 ct/kWh Renewableenergylaw 6,4 ct/kWh Network access 4,8 ct/kWh Generation/acquisition Basic price: (for measuring, accounting, amortization) 13,00 €/month (gross) 3,9 ct/kWh Basic price Atconsumptionof 4.000 kWh/a Source: Basic price, generation, networkaccessbyusingoftarifsofthe Stadtwerke Velbert, November 2015Concessionlevyis an average: Itisdependingfromthepopulation in thecity, Status 2015