Download
1 / 1
10 likes | 38 Views
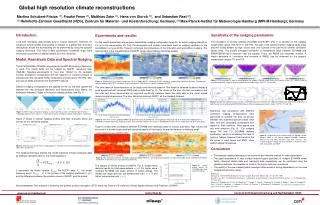
Development of a technique using global spectral model for downscaled reanalysis; Improving temperature, precipitation, wind speed, and humidity observations; Comparison of downscaled analysis with NARR data and AMeDAS observations.

E N D
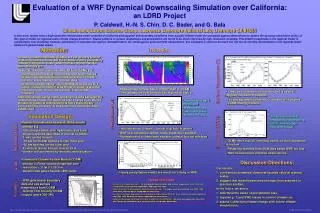
NOAA 32nd Annual Climate Diagnostics and Prediction Workshop, October 22-26, 2007, Tallahassee, FL, USA Kei YOSHIMURA1,2 andMasao KANAMITSU11: Scripps Institution of Oceanography, University of California San Diego2: Institute of Industrial Science, The University of TokyoEmail: k1yoshimura@ucsd.edu, HP: http://meteora.ucsd.edu/~kyoshimura Development of a Spectral Nudging Technique for Global Dynamical Downscaling Summary 3 (cont.). Results of 50km Global Downscaling 2 (cont.). Results of Preliminary Tests Aiming at producing higher resolution global reanalysis datasets from coarse 200 km resolution reanalysis, a global version of the dynamical downscaling using a global spectral model (GSM) is developed. The method includes; 1) nudging of temperature in addition to the zonal and meridional components of winds, 2) nudging is applied to the perturbation field rather than to the perturbation tendency, 3) nudging and correction are removed from the humidity. The downscaling experiment was performed using T248L28 (about 50 km resolution) global model, driven by NCEP/NCAR Reanalysis 2 (T62L28 resolution, about 200km resolution) during 2001. Evaluation with high-resolution observations showed that the monthly averaged global surface temperature and daily variation of precipitation were much improved. Over North America, surface wind speed and temperature are much better, and over Japan, the diurnal pattern of surface temperature is much improved, as are wind speed and precipitation, but not humidity. This study suggests that the global downscaling is a viable and economical method to obtain high-resolution reanalysis without re-running a very expensive high-resolution full data assimilation. In the first right figure, monthly mean wind speed for July 2001 is compared with NARR (Mesinger et al., 2006). The larger wind speed in most of the Pacific side of the continent is reduced to the level of NARR in the downscaled analyses, particularly over Alaska and British Columbia, the west coast of the U.S., and Baja California. A similar reduction is also seen in northern Texas and Oklahoma. Similarly, the second right figure shows deviation of daily mean 2-meter temperature from the monthly averages on July 29, 2001. R2’s colder anomalies were cured in T248 in northern Mexico and the southern U.S. The reason for the improvement is probably because the regions are characterized by complex geography, such as the Gulf of California, the Sierra Madres in northern Mexico and the Great Plains in the U.S., where the dominant scale is much smaller than the critical scale (2000 km). By comparison with Japanese AMeDAS (bottom right figure), temporal variation of the variables (a) wind speed, (b) temperature, (c) humidity, and (d) precipitation for the first 10 days in July 2001 at a single grid point at 140.0E and 36.0N (near Tsukuba, Japan) are all improved except humidity by better diurnal cycle. In precipitation, the downscaled analysis captured a rain event on 6 July, 2001, which was very sharp and short according to the observation, whereas R2 did not have any precipitation in that period. The Table shows both L and a are not significantly sensitive. The comparison between CTL and L1000 and between TEMP and L1000T indicates that the result of the 2000 km nudging scale is sufficiently similar to that of 1000 km. The 2000 km scale was chosen as our default considering the accuracy of Reanalysis data over ocean and tropics. As to the form of the nudging coefficients, ALP2 is almost identical to TEMP and ALP05 is worse than TEMP, implying that it is difficult to significantly decrease the RMSD by adjusting the constant nudging coefficient. SP21Q (N=21 spherical truncation) is about 2000 km nudging scale, but it is worse than NoQ, indicating that it should be more nudged in north-south direction than east-west direction. SP42Q, which is 1000 km scale nudging, is similar level to NoQ. These results indicate that the zonal spectral nudging is slightly effective than the horizontally uniform-scale nudging because of the atmospheric characteristics that tends to have larger scale in east-west-wise than north-south-wise. The TEMP experiment was first thought as the best setting for global downscaling, but it was later discovered that the model significantly overestimates the global precipitation (3.16mm/day in R2, vs. 3.55mm/day in TEMP). In NoQ experiment, the precipitation is reduced to 3.03mm/day, much closer to the Reanalysis, indicating nudging of moisture is unnecessary, or even harmful for inconsistent physical and dynamical processes. Figure: Power spectra of kinetic energy at two different sigma levels. (a) sigma=0.864 and (b) sigma=0.147. Gray lines indicate -3 (dashed) and -5/3 (dotted) slopes for comparison. 1. Introduction/Method Top left figure: Monthly mean surface wind speed at 10 m over North America. (a) Reanalysis 2, (b) T248, and (c) NARR are shown for July 2001. Top right figure: Daily mean surface temperature anomaly from monthly average over North America. (a) Reanalysis 2, (b) T248, and (c) NARR are shown for 29 July 2001. Bottom right figure: Variations of Reanalysis 2 (thin solid line with open square), T248 (black thick line with closed circle), and AMeDAS observation (gray thick line) are compared for (a) surface wind speed, (b) surface temperature, (c) surface humidity, and (d) precipitation. Dynamical downscaling is an alternative to regional data assimilation. As pointed out by von Storch et al. (2000), dynamical downscaling with the spectral nudging technique is considered a “poor person’s data assimilation technique.” In this study, a global version of the dynamical downscaling is developed. The system uses global spectral model and spectral nudging, and produces finer resolution global datasets from 200 km resolution reanalysis. For this purpose, a modified version of the scale-selective bias correction (Kanamaru and Kanamitsu, 2007), is developed. The major objective of this paper is to demonstrate that a “global high-resolution” version of the NCEP global Reanalysis can be produced with relatively low computer cost. Method: Nudging with a specified zonal scale is applied at each Gaussian latitude. The equations for nudging using fully implicit time scheme are written as the equation, where a is a nudging coefficient, and L is a critical nudging scale where waves longer than L will be nudged. 3. A 50 km Global Downscaling We examined how downscaled fields improve the fit to observations in a longer downscaling run. For this purpose, a global downscaling by T248 (about 50 km) resolution model was conducted (experiment named T248) for the year 2001. The NoQ nudging scheme used. In right bottom figures, the downscaled analysis and original reanalysis R2 (T62 resolution) monthly precipitation are compared with those of GPCP (Huffman et al., 2001), CRU, and FCST during January and July 2001. In both months spatial contrasts associated with topography and coastlines become more apparent in the downscaled analysis, for example, in the Himalaya and Sierra Madre Ranges, the Coast Ranges in British Columbia, and the western coastline of India. Table: Averaged correlation coefficient with over 1000 AMeDAS in-situ obs data all over Japan. Figure: Schematic representation of spectral nudging for the Fourier series. 4. Role of Finer Topography To focus on topographic and non-topographic aspects for these improvements, an additional experiment, TOP, that uses the coarse T62 topography in the T248 global model is performed. The bottom right figure shows daily snapshots of temperature anomaly (deviation from monthly mean) and wind of a Santa Ana wind event in Southern California, a Mistral in West Europe, and the katabatic wind in Antarctica. The bottom left figure shows power spectra of kinetic energy, humidity, and temperature for the lowest layer, and precipitation. There are significant decreases in TOP’s power spectra for temperature and precipitation comparing with those of NoQ in small scales (wavenumber > 30 and 50 for temperature and precipitation, respectively), whereas very similar powers are observed for KE (wind) and humidity. These features are almost the same in the July result. This supports that wind field and humidity is relatively less topography-driven than temperature and precipitation. Bottom left figure: Power spectra of kinetic energy (a), humidity (b), and temperature (c), at the lowest sigma level, and precipitation (d), for T248 downscaling with high-resolution topography (NoQ, black) and with low-resolution topography (TOP, green). Bottom right figure: Daily averaged temperature anomalies (shades), winds (arrows), and topography (gray contour; 300 m interval and 0 m line are omitted). From left to right, R2, T248, and TOP; from top to bottom, Santa Ana, Mistral, and Antarctic Katabatic wind. Over the Southern Hemi-sphere oceans however, both the downscaled analysis and R2 show erroneous double-ITCZ over the central south-ern Pacific and the southern Atlantic (near the Atlantic coast of Brazil) in July where-as no such precipitation are found in FCST and GPCP, because significant large-scale errors existed in the global reanalysis fields caus-ing the erroneous double-ITCZ. Top right figure shows the global average of the corre-lations is significantly higher for downscaled analysis throughout the year, indicat-ing better representation of daily precipitation variations in the downscaled analysis. 2. Preliminary Tests We performed a wide range of sensitivity experiments using T126 resolution to find the best setting for global downscaling. The experiments were to determine: 1.Nudging of temperature and moisture (TEMP, NoQ). 2.Critical meridional and zonal nudging scale (L1000, L1000T, SP21Q, SP42Q). 3.Magnitude of nudging coefficient (ALP05, ALP2). Experiments similar to NoQ with different ways of horizontal scaling using the truncation number of the spherical harmonics function, namely N=21 (about 2000 km) and N=42 (about 1000 km), are named SP21Q and SP42Q. In addition, integration without any nudging is performed for comparison (FCST). All the experiments are compared against control (CTL), which is the same setting as the KK07 except the addition of zonal mean correction (“UV nudging” with a=0.9 and L=2000 km). Table: Specification of preliminary T126 experiments Top right figure : Correlation coefficient of R2 and T248 daily precipitation with GPCP are globally averaged in each month. A solid line with circles and a dotted line with squares indicate Reanalsis 2 and T248, respectively.The correlations are calculated on GPCP's 1-degree resolution. Right figure: Global distri-bution of monthly precipitation in January (left column) and July (right column) 2001. The top panels (a, b) are CRU, the next panels (c, d) show GPCP, then R2 (e, f), T248 nudged simulation results are shown (g, h), and finally T248 forecast simulation results (i, j). References: Kanamaru, H. and M. Kanamitsu, 2007: Scale-selective bias correction in a downscaling of global analysis using a regional model, Mon. Wea. Rev., 135, 334-350. Mesinger, F., and co-authors, 2006: North American regional reanalysis, Bull. Amer. Meteor. Soc., 87, 343-360. von Storch, H., H. Langenberg, and F. Feser, 2000: A spectral nudging technique for dynamical downscaling purposes, Mon. Wea. Rev., 128, 3664-3673. Yoshimura, K. and M. Kanamitsu, 2007: Dynamical global downscaling of global reanalysis, submitted to Mon. Wea. Rev. (in rivision) Acknowledgment: This research is funded by JSPS and NOAA.