Download

1 / 15
150 likes | 295 Views
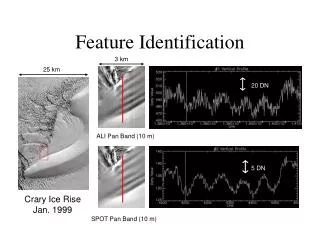
Feature Selection for Tree Species Identification in Very High Resolution Satellite Images. Matthieu Molinier and Heikki Astola VTT Technical Research Centre of Finland matthieu.molinier@vtt.fi , heikki.astola@vtt.fi IGARSS 2011 Vancouver, 28.7.2011. Introduction.

E N D
Feature Selection for Tree Species Identification in Very High Resolution Satellite Images Matthieu Molinier and Heikki Astola VTT Technical Research Centre of Finland matthieu.molinier@vtt.fi, heikki.astola@vtt.fi IGARSS 2011 Vancouver, 28.7.2011
Introduction NewForest – Renewal ofForest Resource Mapping A 1.5-year study (2009-2010) funded by The Finnish Funding Agency for Technology and Innovation (TEKES), with Finnish Companies (forest) and Research Organizations (VTT and University of Eastern Finland UEF) Study motivation Improve methods for operative forest inventory from remote sensing data Species-wise estimates (e.g. stem volume) not accurate enough (accuracy vs. cost)
NewForest approach in forest variable estimation Modelling based on satellite image pixel reflectances and contextual features Refined, more accurate species-wise estimates Combining data to predict total amount and size variation by species segmentation estimates Individual tree crown (ITC) detection and crown width estimation
Study site Karttula / Kuopio, Central Finland 62.9007ºN 27.2392ºE Karttula Mixed forest, spruce dominated 25% pine, 45% spruce, 30% deciduous (mainly birch) GeoEye image, 26.6.2009, RGB NIR 10.5 km x 11.5 km, 3% clouds
Optical image data pre-processing • Rectification to geographic coordinate system (WGS84, NUTM35) • Geo-coding corrected using Digital Elevation Model (Airborne Laser Scanning DEM) : mean corrections 2.65 m, maximum 20 m • Calibration to Top Of Atmosphere (TOA) reflectances using the band-specific calibration coefficients • Atmospherical correction into surface reflectances by applying the SMAC4-radiation transfer code
Ground reference data Training data – from 222 field plots • 212 field plots within GeoEye image area (2009) • 10 additional 0-stem volume plots extracted visually • Tree species classification : training data from 20 pure species field plots Testing data – from 178 field plots (mixed species) • 178 field plots acquired in 2009, limited spatial distribution (several plots per forest stand) In total : 1164 ground objects mapped (276 pines, 277 spruces, 347 deciduous, 264 non-trees) GeoEye image : 10.5 km x 11.5 km
SPECTRAL (5) – set A SEGMENT-WISE (21) – set C RGBNIR PAN mean intensity within 1.5 m radius around tree candidates (TC) From PAN, 3 segment sizes : 50 m2, 85 m2, 125 m2 mean mean / median skewness kurtosis CONTEXTUAL (9) – set B std : standard deviation pmean : partial mean pstd : partial standard deviation From PAN, 7.5 m radius around TC mean mean / median skewness kurtosis contrast pm1 : mean of brightest pixels ps1 : std of brightest pixels pm2 : mean of darkest pixels ps2 : std of darkest pixels Probe variables random vectors or random permutations of a feature vector probe_gauss1, probe_gauss2 probe_shuffle1, probe_shuffle2 Input for feature selection – 35 + 4 features
Tree classes Non-tree classes Class definitions and training scheme WHOLE DATASET (1164 samples) 900 trees, 264 non-trees 2 / 3 1 / 3 MODEL DESIGN (773) 2 / 3 1 / 3 model building ranking TRAINING (512) VAL (261) TESTING (391) stratified sampling to preserve classes proportions
Feature selection preparation (Guyon et al., 2003) • Feature normalization to the range [0, 1] • Visual screening of scatter plots on the 35 real features :no obvious correlations, very few outlier samples • Variable ranking – assessing features one by one with the most simple classifier (single threshold), one(+) vs all(-). 4 scores : • Fisher criteria F, scaled to [0 1] • R2 – Pearson correlation coefficient for a single feature vs +/- labels • AUC : Area under ROC curve (Receiver-Operative Curve) • sum of previous scores (FR2AUC) • All scores computed for every class, then averaged to rank the variables for all 7 classes and for tree classes only (1,2,3). • No single feature outperformed significantly and consistently the others
Feature selection and image classification • Classification accuracy on validation set VAL (261) as a score • Sequential Forward Selection (SFS) with three classification methods : • Linear Discriminant Analysis (LDA) • Quadatric LDA • k-nearest neighbor (kNN) classifier, k [2 9]. Feature selection and choice of k at the same time. • Find the best minimal featuresubset by a brute-force approach • 10 best features from the SFS • retrain the best model using all modeling dataset (TRAIN + VAL) and test with the independent TEST set • brute force approach tractable in this case with simple classifiers • overcome the sub-optimality of SFS
6-10 features is enough Spectral features performed best segment-wise features not suited to mixed species study Overall classification accuracy on tree classes over 80% Probe variables selected more often in the first places with LDA than with kNN : linear classifier too simple. Quadratic LDA was overfitting. kNN, k=5 best overall performance, and lowest difference from training to validation error => lower risk of overfitting
Example of tree species classification map • Pan-sharpened GeoEye image extract of 1 km x 1 km • Individual tree crown classification with 5-NN classifier trained with pure species training data • Non-forest mask generated with • k-means clustering + cluster labeling pine : 76 % spruce : 76 % deciduous : 88 % non-forest
2000 2500 1800 1600 2000 1400 1200 1500 1000 800 1000 600 400 500 200 0 0 0 500 1000 1500 2000 0 500 1000 1500 2000 2500 Predicted species-wise stem numbers vs. field plot data • Predicted stem number per species plot against test data (178 test plots) • Systematic under-estimation of predicted stem number with spruce and deciduous classes • Noise partly due the small collecting radius (r = 8 m) of test data, and to geolocation differences between satellite and ground data 2200 y=0.85*x + 45.0 y=0.33*x + 239.8 y=0.56*x + 21.0 2000 R2 = 0.34 1800 R2 = 0.24 R2 = 0.54 1600 y=0.98*x + 137.1 y=0.98*x + 137.1 1400 y=0.98*x + 137.1 y=0.98*x + 137.1 1200 Predicted [stems/ha] Predicted number of broadleaved/field plot Predicted number of spruces/field plot Predicted number of pines/field plot 1000 800 600 400 200 0 0 500 1000 1500 2000 True number of pines/field plot True number of spruces/field plot True number of broadleaved/field plot Npine [stems/ha] Nspruce [stems/ha] Ndecid [stems/ha]
Conclusions • The methodology could detect individual treetops, identify their species and determine species proportions in mixed forest. • Feature ranking and featureselection was performed on a set of 35 features for tree species classification. • Several classifiers (model including a feature subset and a classification method) were built. The best turned out to be 5-NN with a subset of 6 features, mostly spectral. Segment-wise features could be discarded. • The tree species proportion accuracy was good (1.4% to 3.5%), but the correlation of stem numbers / species not as good as expected. Future work • Model selection with more elaborate classifiers (e.g. SVMs) • Embedding feature selection into a cross-validation scheme • Improve stem number estimation with adaptive filtering • Tree crown width estimation validation with ground data
Thank you matthieu.molinier@vtt.fi heikki.astola@vtt.fi