Download

1 / 11
110 likes | 234 Views
Maximizing Wealth Means Maximizing What Others See as our Wealth.

E N D
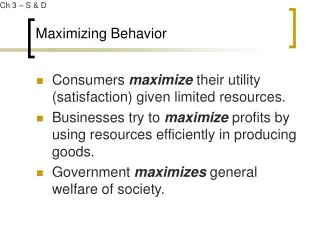
Maximizing Wealth Means Maximizing What Others See as our Wealth. Wealth is what we value and we assume in macroeconomics that if everyone is at least as well off as they used to be, but some are better off, then we have added to the wealth and we will continue to add to wealth until we reach a point of satisfaction or satiation given what we can afford. What we can afford is determined bywhat we are willing to give up in order to produce what we are good at and trade it with the rest of the world, which in recognizing the value to them of what we can offer, are willing to support our relative wealth. What we value is determined , in turn , by our tastes and preferences which leads us to utility maximization in a microeconomic sense and therefore to a wealth maximization position in a macroeconomic sense. This collective hedonism is aggregated over all economic actors and it is assumed that there will exist a representative agent acting in an economic fashion that holds the predominant tastes and preferences of all members of the macro economy and therefore seeks to maximize wealth in the same way as any individual would maximize utility with the same economic results.
Graphics of Wealth Maximization • For A*B* we have wealth W* For A’ B’ we have Wealth W’ so W’ is preferred to W* for a Representative Agent or “Citizen” Wealth All Other Goods (B) B’ W’ B* W* The Good Analyzed (A) A* A’
Analytics of Wealth Maximization • For W* we have a trade off of A*/B* and for W’ we have a trade off of A’/B’. These are the prices of A in terms of B. • If A*/B*=A’/B’ then the wealth curve is a straight line • If A*/B* < A’/B’ the wealth curve is diminishing as we move along it. • If A*/B* > A’/B’ then wealth is increasing as we move along it. • Because we observe that A*/B* < A’/B’ we support that wealth delivers decreasing marginal returns. • This means that when we let all other goods be represented as money and we plot only two dimensions we have wealth contours that are “concave with respect to the origin” and that each contour represents a level of wealth increasingly higher as we move away from the origin. • Moreover any point along that curve is “indifferent” to any other point such that the citizen is just as happy with a combination of A” B” as with A’B’ if they are both on the same “iso-wealth curve”. • But A^B^ is preferred to either A’B’ or A”B” if A^B^ is on a higher “iso-wealth curve”.
Iso-wealth curves • A’B’ = A”B” because they are on Iso-wealth curve I but A^B^ is >A’B’ and A^B^>A”B” because A^B^ is on iso-wealth curve II All Other Goods (B) B’ B^ B” II I A’ A” The Good Analyzed (A) A^
The Link to the Aggregate Demand Curve • As we change the price of one good in terms of another and use money as the measure we can plot the quantity of the analyzed good A versus its price. • Note as the price of Good A increases we can get more of Good B for each level of utility as a result the quantity of A falls as it’s price increases. Thus the demand curve is downward sloping. [If the demand curve were upward sloping it would imply that as the price rises we would see greater quantity consumed and that would perhaps work for a “snob” good.] [Note also that we could consume more of A and B if income rose. If income increases as we consume more that is called a ”normal” good. If it falls as income increases we call it an “inferior” good, We will deal only with “normal” goods.]
We Assume Rationalization of Markets in Wealth Maximization • Markets are rationalized when we participate in market activities only for things that we consider to be “good” as we would not be making ourselves more wealthy if we pursued things that are “bad” or not relevant to our lifestyle. • Thus we have predominant tastes and preferences that are reflected in the goods that are produced and this sends a signal to other parts of the world of the cultural values that our economy holds. In order to access our cultural values they must purchase what we have to offer with what they offer because they value it locally. If the goods in a trading partner’s cultural economy are useful in our economy then they will value what we have to offer on the basis of how much of their production they are willing to give up to gain some of our production. Wealth can only be maximized in terms of a trading rationalization amongst states. • Wealth must also be rationalized between the current period and a following period or set of periods given that temporary surpluses may provide us with the opportunity to set aside something for the future and that places a value or a price on today’s goods with respect to tomorrow’s goods. Wealth can only be maximized in terms of an efficient market for savings and investment. • Wealth must also be managed by a benevolent or widely supported government that maintains the security of the state and the welfare of its citizens such that others have confidence in the stability and “rightness” of its economic choices. Wealth can only be maximized in a peaceful setting wherein the government adds and subtracts resources according to the welfare needs of its citizens.
The Aggregate Demand Curve • This is a record of the quantity of a good demanded from the market as the price changes. It is downward sloping and has several key elements. • There is reservation price at which a good is offered for sale for the very first time. • There is also a saturation quantity at which the market will not pay anything at all for the good. • The demand cure represents both the ability of consumers to demand a product from the market and also the willingness (based on preferences) to pay any price between the reservation price and the saturation quantity. • This is the total surplus that consumers dedicate to this market. It is the implicit value based on how good A is valued in terms of all other goods B. If such a trade off were not made there would be no market at all for good A so the price of A is a “true” reflection of the value of A within the economy when each individual preference choice of each individual consumer is simply added up. • This is also a disciplined market in the aggregate recognizing • that other countries may also produce the good and the landed price of an imported good rationalizes what consumers are able and willing to pay for this good. • That there is a need for stability into the future that is supported by a freely functioning banking system that supports and encourages savings and investment. • That there is benevolent government that supports the welfare of its citizens.
Aggregate Demand Curve • Economic Surplus is Wealth when it is typical of a nations economic choices relative to the rest of the world, to the future, and to the welfare of its citizens. Price of A Reservation Price Economic Surplus = Wealth Saturation Quantity Quantity of A
Endowment Impacts on Aggregate Demand Differences in geography, culture and climate have a profound impact on the potential for an economy to produce a set bundle of products even if they are more valued than they are in another location. Combined with the level of technology and the security and confidence in the rules under which trade is conducted in that economy leads to a set of varying bundles that are feasible to produce. This set of bundles is known as the Production Possibilities Curve(PPC). The PPC is the boundary of efficiency (the lowest possible input set for the greatest combination of goods) and also theboundary of effectiveness (the greatest availability in terms of infrastructure for the greatest combination of goods). It is therefore convex with respect to the origin. Therefore when the price from the aggregate demand line (which is always linear) is tangent to the PPC there is an equilibrium point at which the representative agent is satiated with the amount of production and the value of that production and this point is both efficient and effective. As a result the wealth is optimized as is the welfare of the macroeconomic economy at this equilibrium point.
The Production Possibility Curve • Good B Allocation A*:B* is efficient and effective for Aggregate Demand and the Production Possibility Curve Production Possibility Curve Good A A* Aggregate Demand B*
Similarities to Consumer Demand • The Consumer Demand and the Aggregate Demand are analyzed in the same way and have equilibria that are both efficient and effective but have additional requirements in the Aggregate for: International Markets Banking and Finance Political Stability of The Government