Maximizing Behavior and Market Dynamics in Economics
Understand how consumers, businesses, and governments maximize utility and profits in economic interactions. Explore concepts like supply and demand, market participants, and the circular flow of goods and services.

Maximizing Behavior and Market Dynamics in Economics
E N D
Presentation Transcript
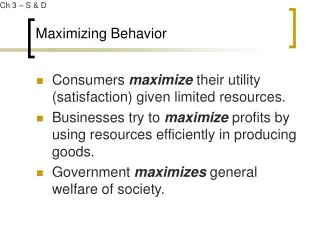
Ch 3 – S & D Maximizing Behavior • Consumers maximize their utility (satisfaction) given limited resources. • Businesses try to maximize profits by using resources efficiently in producing goods. • Government maximizes general welfare of society.
Specialization and Exchange • Our economic interactions with others is necessitated by two constraints (Why do we trade?): • Our absolute inability as individuals to produce all the things we need or desire. • The limited amount of time, energy, and resources we have producing those things we could make for ourselves.
Markets: • Factor markets - where factors of production (e.g., land, labor, capital) are bought and sold. • Product Markets - where finished goods and services (products) are bought and sold. The Circular Flow Market Participants: • Consumers • Business firms • Government • Foreigners
International participants International participants Business Firms Product markets Factor markets Governments Consumers The Circular Flow Goods and services demanded Goods and services supplied Factors of production supplied Factors of production demanded
Supply and Demand • There must be a buyer and a seller in every market transaction. • The seller is on the supply side of the market. • The buyer is on the demand side of the market.
Supply and Demand • Supply - the ability and willingness to sell (produce) specific quantities of a good at alternative prices in a given time period, ceteris paribus. • Demand- the ability and willingness to buy specific quantities of a good at alternative prices in a given time period, ceteris paribus.
Individual Demand • Demand schedule - table showing the quantities of a good a consumer is willing and able to buy at alternative prices in a given time period, ceteris paribus. • Demand curve – curve (graph) describing the quantities of a good a consumer is willing and able to buy at alternative prices in a given time period, ceteris paribus.
PRICE A $50 B 45 C 40 D 35 E 30 F 25 G 20 H 15 I 10 5 0 2 4 6 8 10 12 14 16 18 20 Quantity of Tutoring Demanded (hours) Demand Schedule and Curve
Individual Demand • “Demand” is an expression of consumer buying intentions – of a willingness to buy – not a statement of actual purchases. • Law of demand - the quantity of a good demanded in a given time period increases as its price falls, ceteris paribus.
Determinants of Demand • Determinants of market demand include: • Tastes — desire for this and other goods. • Income — of the consumer. • Other goods — their availability and price. • Expectations — for income, prices, tastes. • Number of buyers.
Other Goods • Substitute goods substitute for each other. • When the price of good x rises, the demand for good y increases, ceteris paribus. • Complementary goods are frequently consumed in combination. • When the price of good x rises, the demand for good y falls, ceteris paribus.
Movements vs. Shifts • Changes in quantity demanded – movements along a demand curve, in response to price changes for that good. • Changes in demand – shifts of the demand curve due to changes in tastes, income, other goods, or expectations.
PRICE $45 40 d2 35 30 25 g1 20 15 10 5 0 2 4 6 8 10 12 14 16 18 20 22 Quantity Movements vs. Shifts Shift in demand d1 D2 increased demand Movement along curve D1 initial demand
Market Demand • Market demand - total quantities of a good or service people are willing and able to buy at alternative prices in a given time period. • The sum of individual demands. • Market demand is determined by the number of potential buyers and their respective tastes, incomes, other goods and expectations.
Tom’s demand curve George’s demand curve Lisa’s demand curve My demand curve $50 40 30 Price 20 10 0 4 8 12 16 0 4 8 12 16 20 24 28 0 4 8 12 0 4 8 12 Construction of the Market Demand Curve + + + =
The market demand curve $50 A B 40 C D 30 E Price F 20 G H 10 I 0 4 12 20 28 36 Quantity Demanded Construction of the Market Demand Curve =
Supply • Market supply - total quantities of a good that sellers are willing and able to sell at alternative prices in a given time period, ceteris paribus. Determinants of Supply • Factor costs • Technology • Other goods • Taxes and subsidies • Expectations • Number of sellers
Law of Supply • Larger quantities will be offered for sale at higher prices. • Supply curves are upward-sloping to the right. • As price increases, quantity supplied also increases, ceteris paribus.
Market Supply • The market supply curve is just a summary of the supply intentions of all producers. • Market supply is an expression of sellers’ intentions – an offer to sell – not a statement of actual sales.
Shifts of Supply • Changes in quantity supplied — movements along the supply curve. • Changes in supply — shifts in the supply curve.
Equilibrium • Equilibrium price - price at which the quantity of a good demanded in a given time period equals the quantity supplied. • This market outcome (market clearing price) is efficient. QD = QS
Equilibrium Price Price $50 Market demand Market supply 45 40 At equilibrium price, quantity demanded equals quantity supplied 35 30 25 20 Equilibrium price 15 10 5 0 25 39 50 75 100 125 Quantity
The Invisible Hand • Market mechanism - use of market prices and sales to signal desired outputs (or resource allocations). • Adam Smith characterized this market mechanism as the invisible hand.
Market Surplus • Market surplus is the amount by which the quantity supplied exceeds the quantity demanded at a given price – excess supply. QD < QS • Market shortage - amount by which the quantity demanded exceeds the quantity supplied at a given price – excess demand. QD > QS
Surplus x y Shortage Surplus and Shortage Price $50 Market demand Market supply 45 40 35 30 25 20 Equilibrium price 15 10 5 0 25 39 50 75 100 125 Quantity
Changes in Equilibrium • No equilibrium price is permanent. • The equilibrium price will change whenever the supply or demand curve shifts. • Changes (shifts) in supply and demand occur when the underlying determinants of supply and demand change.
Price $50 40 E2 30 New demand 20 10 0 25 50 75 100 Quantity Changes in Equilibrium Demand Shift Market supply E1 Initial demand
Price $50 40 E3 30 20 10 0 25 50 75 100 Quantity Changes in Equilibrium Supply Shift Market supply E1 Initial demand
Disequilibrium Pricing • Electricity prices increased in California because of an increase in demand and a decrease in supply. • The demand curve shifted rightward. • The supply curve shifted leftward. • The California legislature put a price ceiling on retail electricity prices. • Price ceiling - upper limit imposed on the price of a good.
Price Ceilings Create Shortages • Price ceilings have three predictable effects: • Increase the quantity demanded. • Decrease the quantity supplied. • Create a market shortage.
40 D2 New demand S2 New supply 35 D1 Old demand S1 Old supply E2 30 shift in supply 25 Price Of Electricity (cent per kilowatt-hour) shift in demand 20 15 Price ceiling 10 E1 5 0 qe2 qdc qsc Quantity Of Electricity (megawatts per hour) Price Ceilings Create Shortages shortage