Download
1 / 40
410 likes | 598 Views
Automated Ranking Of Database Query Results. Sanjay Agarwal - Microsoft Research Surajit Chaudhuri - Microsoft Research Gautam Das - Microsoft Research Aristides Gionis - Computer Science Dept Stanford University Presented by: Suvigya Jaiswal (Fall 10).

E N D
Automated Ranking Of Database Query Results • Sanjay Agarwal- Microsoft Research • SurajitChaudhuri - Microsoft Research • Gautam Das - Microsoft Research • Aristides Gionis - Computer Science Dept Stanford University • Presented by: SuvigyaJaiswal (Fall 10)
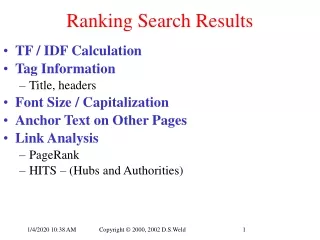
Ranking As the name suggests ‘Ranking’ is the process of ordering a set of values (or data items) based on some parameter that is of high relevance to the user of ranking process. Ranking and returning the most relevant results of user’s query is a popular paradigm in information retrieval.
Introduction Automated Ranking is used in Information Retrieval(IR). Database Systems do not support Automated Ranking but support only Boolean Query model. Following scenarios not handled well by SQL Systems Empty Answers(Query too specific) Many Answers(Query not specific)
Introduction How to adapt ranking functions from IR to handle Database ranking problem? 1.When each of the attribute in the relation is a categorical attribute , mimic the IR solution by applying the TD-IDF idea of frequency of values 2. When attributes are also numerical ,extend the TD-IDF concepts to numerical domains. In some cases the TF-IDF idea does not produce results with desired accuracy, in these cases we use workload information to arrive at better results.
Contributions of Paper IDF Similarity QF similarity QFIDF Similarity Index Based Threshold Algorithm:
IDF Similarity: Intro Given: A Table R Attributes {A1,….,Am) Tuples {T1,….,Tn} Valuek Query’s WHERE clause is of the form: “Where C1 AND C2 AND ….. AND Cm”
Attributes Categorical Attribute Numerical Attribute T u p l es
Cosine Similarity Cosine Similarity from IR can be applied when the database has only categorical attributes. Tuple and Query are considered a small document. A documents is an m-dimensional vector with m words ith element in the vector represents the TF of the word. Cosine Similarity:
Cosine Similarity IDF used to further refine Cosine Similarity IDF(w)= log(N/F(w)) N is number of documents F(w) is the number of documents in which w appears. Idea behind using IDF? More often occurring words convey information than rarely occurring words.
IDF Similarity For every value t in the domain of Ak, IDFk(t) is defined as IDFk(t)=log(n/Fk(t)) n=# of tuples , Fk(t)) is the frequency of tuplesAk=t T=<t1,……tm> Q=<q1,…...qm> Condition is of the form “WHERE A1=q1 AND A2=q2 ,….., AND Am=qm “ Sk (u,v) = IDFk(u) if u=v Otherwise, Sk (u,v)=0
Uses As an Example say we want to find all convertibles made by Nissan. The System will return the following: All Convertibles made by Nissan. All the Convertibles made by other manufacturers. All Nissan Cars which may not be convertibles. Why so? Convertible is a rarer car type than other Nissan cars.
IDF Similarity for Numerical Data Why the IDF Similarity for categorical data cannot be used for numeric data? SELECT * FROM R WHERE PRICE=300K AND BEDROOM = 10; S(u,v) will incorrectly evaluate to zero. Since 315K and 305K are close to 300K (resp. 9 & 10) but not equal.
IDF Similarity for Numerical Data Solution: {t1,t2…..tn} be the values of attribute A. For every value t The denominator represents the sum of contributions to t from every other ti Further t is from ti , lesser is the contribution from ti
IDF Similarity for Numerical Data Similarity is defined as density at ‘t’ of a Gaussian Distribution centered at q. Suppose there are n1tuples that have the same value and the remaining n-n1tuples have a value far from t. 1. If q belongs to n-n1 then S(t,q) almost 0 2. If q belongs to n1 then S(t,q) = log (n/nt)
QF Similarity Why is IDF Similarity not sufficient ? Examples: 1. In a database , more homes are built in recent years than in the pervious years (1980’s). But IDF of the homes built in recent years will be less. Yet the demand for newer homes is more. 2. In a bookstore DB, the demand of a particular author’s work might be more even if he has written many books. But the IDF of that author will be low.
QF Similarity The Idea behind QF Similarity is that the importance of attribute values is related to the frequency of their occurrence in the query string in the workload In previous example it is reasonable to assume that the queries for newer homes appears more often than queries for older homes Also the query for a particular author might appear more often than the other authors if his books are more popular in spite of him having many books
QF Similarity We define query frequency QF as QF(q) = RQF(q)/ RQFMax RQF(q) raw frequency of occurrence of value q of attribute A in query strings of workload RQFMax raw frequency of most frequently occurring value in workload S(t,q)=QF(q) if q=t else 0
Similarity between different attributes If we use IDF or QF Similarity to measure any of the following we get 0 as the answer S(Toyota, Honda)=0 S(Accord, Camry)=0 1.But we know that Honda and Toyota make cars that are directed toward the same market segment. 2.Accord and Camry are the same type of Cars of comparable quality
Similarity between different attributes To solve this problem we apply the intuition that if certain pair of values(t<>u) often occur together in the work load then they are similar. For example if we receive many queries which has C-Conditions of the form “MFR IN {Toyota, Honda, Nissan}” It suggest that Toyota, Honda and Nissan are more similar to each other than they are to Ferrari or Mercedes Hence we can say that by using this metric, S(Toyota, Honda)=0.8 S(Ferrari, Toyota)=o.1
Similarity between different attributes Let W(t) be the subset of Queries in workload W in which the categorical value t appears(in our example say Toyota) in an IN clause. Jaccard Coefficient measures similarity b/w W(t) and W(q) Similarity coefficient is then defined as:
QFIDF Similarity • QF Similarity can be unreliable in certain situations. • This happens because QF Similarity is purely workload based. It doesn’t take data values into account. • To tackle this we define QFIDF Similarity: S(t,q)=QF(q) *IDF(q) when t=q 0, otherwise where QF(q)=(RQF(q)+1)/(RQFMax+1). 1 is added to the numerator and denominator so that QF is never zero.
Many Answer Problem. IDF Similarity and QF Similarity may sometimes run into problem: many tuples may tie for the same similarity score and thus get ordered arbitrarily. Approach is to determine weights of missing attribute values that reflect their “global importance” for ranking purposes IF we seek homes with four bedrooms in DB, we can examine attributes other than number of bedrooms to rank the result set. If we knew that “Dallas” is a more important location than “Fort-Worth” in a global sense, we would rank four bedroom homes in Dallas higher than four bedroom homes in Fort-Worth.
We use workload information to determine global importance of missing attribute values. We define the global importance of missing attribute value tk as log(QFk(tk)) Extend QF Similarity to use the quantity Sum(log(QFk(tk))) to break ties in each equivalence class (larger this quantity1, higher the rank of the tuple) where the summation is over missing attributes. An alternative strategy is to rank tied tupleshigher if their missing attribute values have small IDF, i.e. occur more frequently in the database.
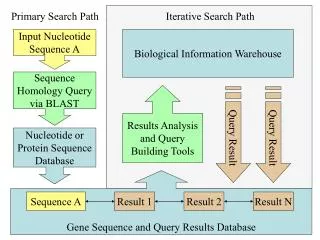
Implementation Two Phases: Pre-processing component Query processing component
Pre-processing component Compute IDF(t) (resp. QF(t)) for all categorical values t involves scanning the database (resp. scanning/parsing the workload) to compute frequency of occurrences of values in the database (resp. workload), and store the results in auxiliary tables. We cannot pre-compute IDF(q) (resp. QF(q)) for numerical attributes; thus we have to store an approximate representation of the smooth function IDF( ) (resp. QF( )) so that the function value at any q can be retrieved at runtime.
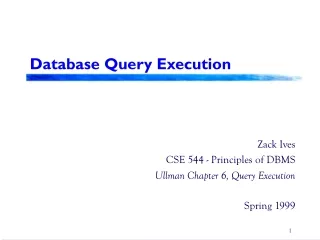
Query processing component main task of the query processing component is, given a query Q and an integer K, to efficiently retrieve the Top-K tuples from the database using one of the ranking functions.
A simpler query processing problem Inputs: (a) a database table R with m categorical columns, clustered on key column TID, where standard database indexes exist on a subset of columns, (b) A query expressed as a conjunction of m single-valued conditions of the form Ak = qk., and (c) an integer K. Similarity function: Overlap Similarity Output: The Top-K tuples of R most similar to Q.
An index-based Top-K implementation: monotonic property: if T and U are two tuplessuch that for all k, Sk(tk,qk)< Sk(uk,qk) then SIM(T,Q) <=SIM(U, Q). adapt Fagin’s Threshold Algorithm (TA) Two types of access methods required Sorted Access Random Access use of an early stopping condition, by which the algorithm can detect that the final Top-K tuples have been retrieved before all tupleshave been processed.
d: 0.9 a: 0.85 b: 0.7 . . . . c: 0.2 Threshold Algorithm • Read all grades of an object once seen from a sorted access • No need to wait until the lists give k common objects • Do sorted access (and corresponding random accesses) until you have seen the top k answers. • How do we know that grades of seen objects are higher • than the grades of unseen objects ? • Predict maximum possible grade unseen objects: L2 L1 a: 0.9 Seen b: 0.8 c: 0.72 T = min(0.72, 0.7) = 0.7 f: 0.6 . . . . f: 0.65 Possibly unseen Threshold value d: 0.6
ID L2 L1 (d, 0.9) (a, 0.9) (b, 0.8) (a, 0.85) (c, 0.72) (b, 0.7) A1 Min(A1,A2) A2 . . . . . . . . (d, 0.6) (c, 0.2) Example – Threshold Algorithm For each object seen: - get all grades by random access - determine Min(A1,A2) - amongst 2 highest seen ? keep in buffer Step 1: - parallel sorted access to each list a 0.9 0.85 0.85 0.6 0.9 0.6 d
ID L2 L1 a: 0.9 d: 0.9 a: 0.85 b: 0.8 a 0.9 b: 0.7 c: 0.72 0.9 d A2 Min(A1,A2) A1 . . . . . . . . d: 0.6 c: 0.2 Example – Threshold Algorithm Step 2: - Determine threshold value based on objects currently seen under sorted access. T = min(L1, L2) - 2 objects with overall grade ≥ threshold value ? stop else go to next entry position in sorted list and repeat step 1 0.85 0.85 0.6 0.6 T = min(0.9, 0.9) = 0.9
ID L2 L1 (a, 0.9) (d, 0.9) (b, 0.8) (a, 0.85) (c, 0.72) (b, 0.7) A1 A2 Min(A1,A2) . . . . . . . . (d, 0.6) (c, 0.2) Example – Threshold Algorithm Step 1 (Again): - parallel sorted access to each list For each object seen: - get all grades by random access - determine Min(A1,A2) - amongst 2 highest seen ? keep in buffer a 0.9 0.85 0.85 d 0.6 0.9 0.6 b 0.8 0.7 0.7
ID L2 L1 a: 0.9 d: 0.9 a: 0.85 b: 0.8 a 0.9 b: 0.7 c: 0.72 0.7 b A2 Min(A1,A2) A1 . . . . . . . . d: 0.6 c: 0.2 Example – Threshold Algorithm Step 2 (Again): - Determine threshold value based on objects currently seen. T = min(L1, L2) - 2 objects with overall grade ≥ threshold value ? stop else go to next entry position in sorted list and repeat step 1 0.85 0.85 0.7 0.8 T = min(0.8, 0.85) = 0.8
ID L2 L1 a: 0.9 d: 0.9 a: 0.85 b: 0.8 a 0.9 b: 0.7 c: 0.72 0.7 b A2 Min(A1,A2) A1 . . . . . . . . d: 0.6 c: 0.2 Example – Threshold Algorithm Situation at stopping condition 0.85 0.85 0.7 0.8 T = min(0.72, 0.7) = 0.7
Experiment Results Quality results For queries with empty answers, QFIDF produced the best rankings, followed by QF, then IDF, and finally Overlap. For queries with empty answers, the ranking quality of QF improves with increasing workload size. For queries with numerous answers, QF produced better rankings than IDF. Performance results The preprocessing time and space requirements of all techniques scale linearly with data size. When all indexes are present, ITA is more efficient than SQL Server Top-K for all similarity functions. Even when a subset of indexes is present, ITA can perform well
References http://www.emeraldinsight.com/journals.htm?articleid=1563479 Ppt Slides by RamyaSoumri(Fall 09) [14] R. Fagin. Fuzzy Queries in Multimedia Database Systems.PODS 1998.